Github项目 - Mask R-CNN 的 Keras 实现 概括了整个项目. 这里分析 COCO 数据 - inspect_data.ipynb
这里根据源码里的次序, 逐步分析学习. 有利于深入了解 COCO 数据, 以及该项目的数据加载与处理过程.
- 导入相关库
##############################################################
# Mask R-CNN - Inspect Training Data 观察训练数据
#              数据加载和预处理的过程.
##############################################################


import os
import sys
import random
import numpy as np
import matplotlib.pyplot as plt
import matplotlib.patches as patches

# 项目根目录
ROOT_DIR = os.path.abspath("../../")

# Import Mask RCNN 模块
sys.path.append(ROOT_DIR)  # find local version of the library
from mrcnn import utils
from mrcnn import visualize
from mrcnn.visualize import display_images
import mrcnn.model as modellib
from mrcnn.model import log
- 配置 COCO 数据集
#########################################
# 配置数据集
# 选择 Shapes 数据集或者 COCO 数据集
#########################################

# Shapes toy dataset
# import shapes
# config = shapes.ShapesConfig()

# MS COCO Dataset
import coco
config = coco.CocoConfig()
COCO_DIR = "/data/datasets/COCO/"


# 加载数据集
if config.NAME == 'shapes':
    dataset = shapes.ShapesDataset()
    dataset.load_shapes(500, config.IMAGE_SHAPE[0], config.IMAGE_SHAPE[1])
elif config.NAME == "coco":
    dataset = coco.CocoDataset()
    dataset.load_coco(COCO_DIR, "train")

# Must call before using the dataset
dataset.prepare()

print("Image Count: {}".format(len(dataset.image_ids)))
print("Class Count: {}".format(dataset.num_classes))
for i, info in enumerate(dataset.class_info):
    print("{:3}. {:50}".format(i, info['name']))
输出: creating index... index created! Image Count: 82081 Class Count: 81 0. BG 1. person 2. bicycle 3. car 4. motorcycle 5. airplane 6. bus 7. train 8. truck 9. boat 10. traffic light 11. fire hydrant 12. stop sign 13. parking meter 14. bench 15. bird 16. cat 17. dog 18. horse 19. sheep 20. cow 21. elephant 22. bear 23. zebra 24. giraffe 25. backpack 26. umbrella 27. handbag 28. tie 29. suitcase 30. frisbee 31. skis 32. snowboard 33. sports ball 34. kite 35. baseball bat 36. baseball glove 37. skateboard 38. surfboard 39. tennis racket 40. bottle 41. wine glass 42. cup 43. fork 44. knife 45. spoon 46. bowl 47. banana 48. apple 49. sandwich 50. orange 51. broccoli 52. carrot 53. hot dog 54. pizza 55. donut 56. cake 57. chair 58. couch 59. potted plant 60. bed 61. dining table 62. toilet 63. tv 64. laptop 65. mouse 66. remote 67. keyboard 68. cell phone 69. microwave 70. oven 71. toaster 72. sink 73. refrigerator 74. book 75. clock 76. vase 77. scissors 78. teddy bear 79. hair drier 80. toothbrush
- 随机显示图片样本
#########################################
# 显示数据集样本
#########################################

# 随机加载图片样本并显示
image_ids = np.random.choice(dataset.image_ids, 4)
for image_id in image_ids:
    image = dataset.load_image(image_id)
    mask, class_ids = dataset.load_mask(image_id)
    visualize.display_top_masks(image, mask, class_ids, dataset.class_names)
- 显示边界框 Bounding Boxes
#########################################
# 显示边界框 Bounding Boxes
# 这里的边界框是根据 masks 计算得到.
# 以便于图片 resize, rotate, crop 等.
# 只需要根据 masks 计算边界框即可,
# 而不是计算边界框的变换.
#########################################

# 随机加载一张图片和 mask
image_id = random.choice(dataset.image_ids)
image = dataset.load_image(image_id)
mask, class_ids = dataset.load_mask(image_id)
bbox = utils.extract_bboxes(mask) # Compute Bounding box

# Display image and additional stats
print("image_id ", image_id, dataset.image_reference(image_id))
log("image", image)
log("mask", mask)
log("class_ids", class_ids)
log("bbox", bbox)
# Display image and instances
visualize.display_instances(image, bbox, mask, class_ids, dataset.class_names)
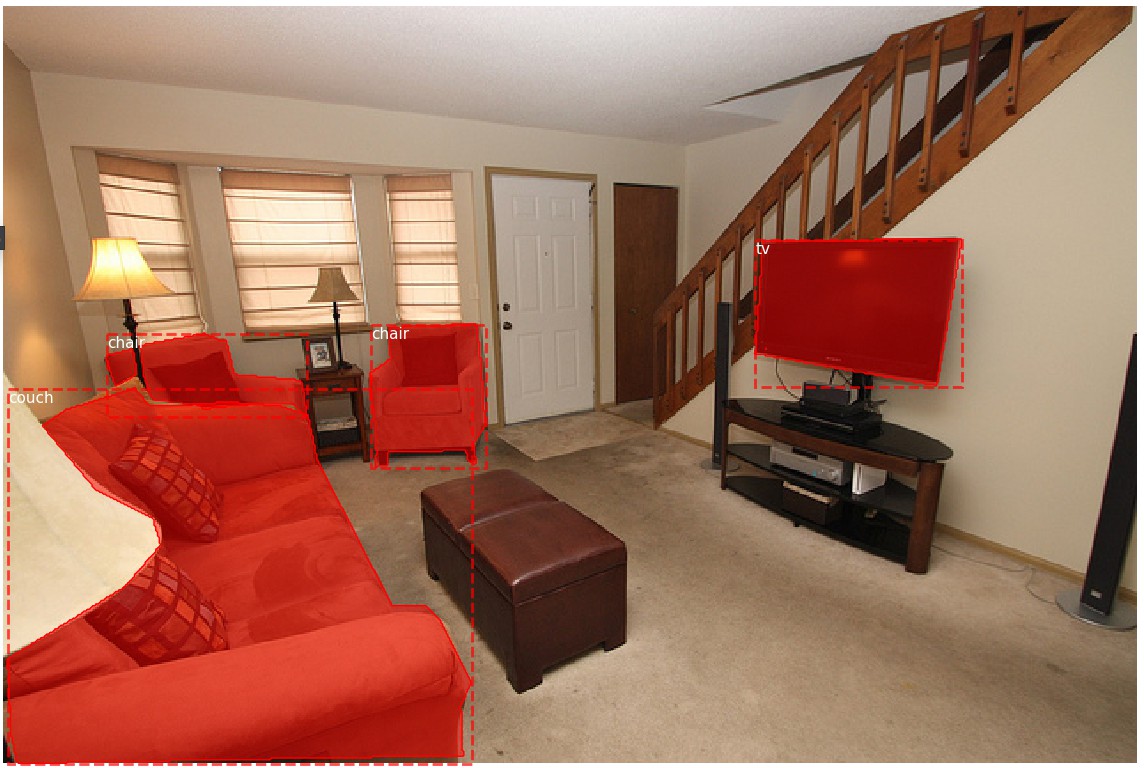
('image_id ', 66646, 'http://cocodataset.org/#explore?id=367718') image shape: (427, 640, 3) min: 0.00000 max: 255.00000 uint8 mask shape: (427, 640, 4) min: 0.00000 max: 1.00000 bool class_ids shape: (4,) min: 57.00000 max: 63.00000 int32 bbox shape: (4, 4) min: 2.00000 max: 541.00000 int32
- 图片 Resize
#########################################
# 图片 Resize
#########################################

# Load random image and mask.
image_id = np.random.choice(dataset.image_ids, 1)[0]
image = dataset.load_image(image_id)
mask, class_ids = dataset.load_mask(image_id)
original_shape = image.shape
# Resize
image, window, scale, padding, _ = utils.resize_image(image,
                                                      min_dim=config.IMAGE_MIN_DIM,
                                                      max_dim=config.IMAGE_MAX_DIM,
                                                      mode=config.IMAGE_RESIZE_MODE)
mask = utils.resize_mask(mask, scale, padding)
bbox = utils.extract_bboxes(mask)  # Compute Bounding box

# Display image and additional stats
print("image_id: ", image_id, dataset.image_reference(image_id))
print("Original shape: ", original_shape)
log("image", image)
log("mask", mask)
log("class_ids", class_ids)
log("bbox", bbox)
# Display image and instances
visualize.display_instances(image, bbox, mask, class_ids, dataset.class_names)
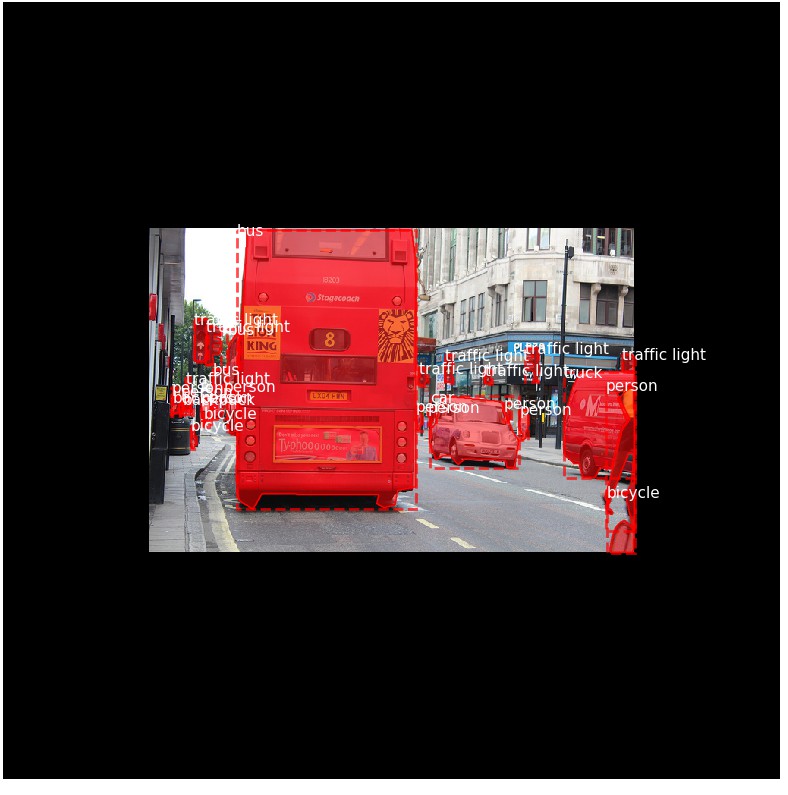
('image_id: ', 22573, 'http://cocodataset.org/#explore?id=558876') ('Original shape: ', (427, 640, 3)) image shape: (1024, 1024, 3) min: 0.00000 max: 255.00000 uint8 mask shape: (1024, 1024, 27) min: 0.00000 max: 1.00000 bool class_ids shape: (27,) min: 1.00000 max: 25.00000 int32 bbox shape: (27, 4) min: 221.00000 max: 832.00000 int32
- Mini Masks
###############################################
# Mini Masks
# 对于高分辨率的图片, 其实例二值 masks 可能很大.
# 例如, 1024x1024 的图片, 单个实例 mask 需要 1MB 的内存
# (Numpy 采用 bytes 来表示 boolean 值.)
# 如果一张图片有 100 个实例, 将有 100MB 的 masks.
#
# 为了提高训练速率, 对 masks 进行优化:
#    - 保存在物体边界框内的 mask 像素, 而不是整张图片保存为一个 mask.
#     大部分物体相对于图片尺寸比较小, 因此, 可以避免保存物体周围的很多 0 值,
#     以节省空间.
#   - Resize mask 到更小的尺寸,(如 56x56).
#     对于物体大于设定尺寸的, 可能会损失一部分精度.
#     但,大部分物体标注开始是不很精确的, 在实际应用中可以忽略这部分损失.
#     mini_mask 的尺寸可以在 config 类中定义.
#
# 根据示例,来测试 mask resizing 的效果.
###############################################

image_id = np.random.choice(dataset.image_ids, 1)[0]
image, image_meta, class_ids, bbox, mask = modellib.load_image_gt(dataset,
                                                                  config,
                                                                  image_id,
                                                                  use_mini_mask=False)

log("image", image)
log("image_meta", image_meta)
log("class_ids", class_ids)
log("bbox", bbox)
log("mask", mask)

display_images([image]+[mask[:,:,i] for i in range(min(mask.shape[-1], 7))])

visualize.display_instances(image, bbox, mask, class_ids, dataset.class_names)


# Add augmentation and mask resizing.
image, image_meta, class_ids, bbox, mask = modellib.load_image_gt(dataset,
                                                                  config,
                                                                  image_id,
                                                                  augment=True,
                                                                  use_mini_mask=True)
log("mask", mask)
display_images([image]+[mask[:,:,i] for i in range(min(mask.shape[-1], 7))])


mask = utils.expand_mask(bbox, mask, image.shape)
visualize.display_instances(image, bbox, mask, class_ids, dataset.class_names)
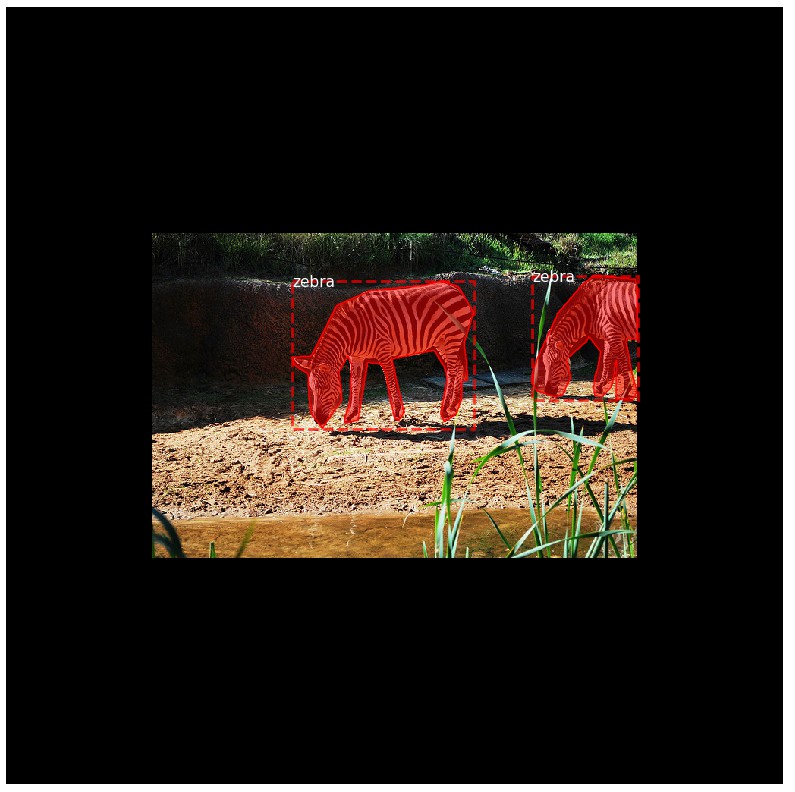
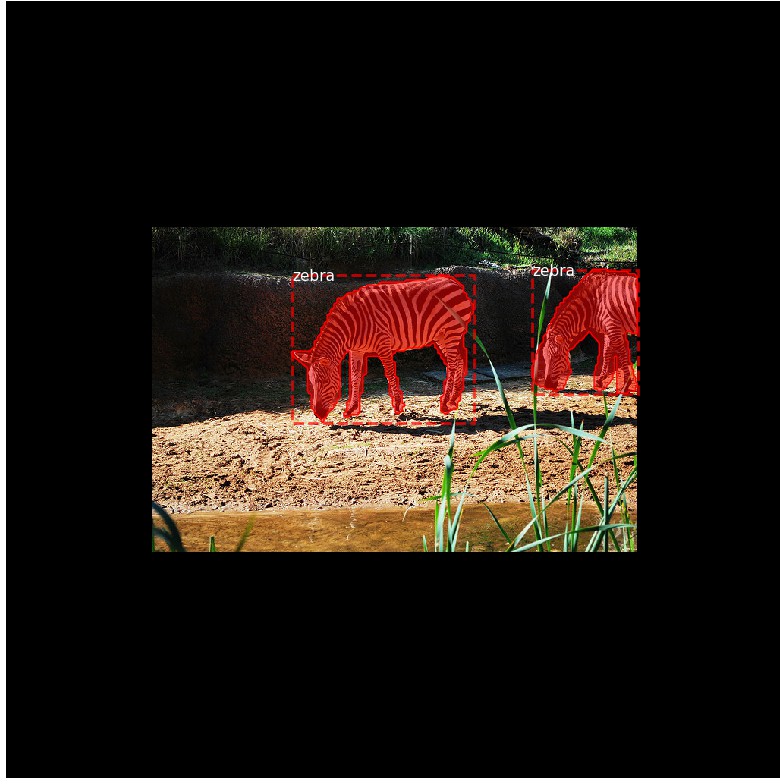
image shape: (1024, 1024, 3) min: 0.00000 max: 255.00000 uint8 image_meta shape: (93,) min: 1.00000 max: 2910.00000 int64 class_ids shape: (2,) min: 23.00000 max: 23.00000 int32 bbox shape: (2, 4) min: 353.00000 max: 832.00000 int32 mask shape: (1024, 1024, 2) min: 0.00000 max: 1.00000 bool mask shape: (56, 56, 2) min: 0.00000 max: 1.00000 bool
- Anchors
##########################################################################
# Anchors
# Anchors 的次序是很重要的. 训练和预测阶段采用相同的次序. 且必须保持卷积执行的次序.
# 对于 FPN 网络, Anchors 的次序配置方式, 应尽可能的使 anchors 与卷积层的输出相匹配.
# 卷积层的输出预测了 anchor 的 scores 和偏移 shifts.
#  - 首先,根据金字塔层(pyramid level) 排序 anchors. 先是, 第一层所有的 anchors,
#    再是, 第二层所有的 anchors, 依次. 这样更容易根据层来分离 anchors.
#  - 每一金字塔层内, 根据 feature map 处理顺序来排序 anchors. 典型地, 一个卷积层
#    是从左上角(top-left)开始对 feature map 处理, 一行一行地往右移动.
#  - 对于每个 feature map 单元, 对具有不同比率(ratios) anchors 任意选择排序方式.
#    这里, 与传递到函数的 ratios 次序一致.
#
# Anchors Stride 步长
# 在 FPN 结构中, 前几层 feature map 的分辨率比较大. 例如, 如果输入图片是 1024x1024,
# 则, 第一层 feature map 的分辨率是 256x256, 能够生成大概 200K anchors(256x256x3)
# 这些 anchors 是 32x32 像素的, 其步长相对于图片是 4, 因此会有大量的重叠.
# 如果对 feature map 内的每个其它单元cell 生成 anchors,可以明显地减少工作量.
# 例如, 步长 2 会把 anchors 的数量减少 4 倍.
##########################################################################

# Generate Anchors
backbone_shapes = modellib.compute_backbone_shapes(config, config.IMAGE_SHAPE)
anchors = utils.generate_pyramid_anchors(config.RPN_ANCHOR_SCALES,
                                         config.RPN_ANCHOR_RATIOS,
                                         backbone_shapes,
                                         config.BACKBONE_STRIDES,
                                         config.RPN_ANCHOR_STRIDE)

# Print summary of anchors
num_levels = len(backbone_shapes)
anchors_per_cell = len(config.RPN_ANCHOR_RATIOS)
print("Count: ", anchors.shape[0])
print("Scales: ", config.RPN_ANCHOR_SCALES)
print("ratios: ", config.RPN_ANCHOR_RATIOS)
print("Anchors per Cell: ", anchors_per_cell)
print("Levels: ", num_levels)
anchors_per_level = []
for l in range(num_levels):
    num_cells = backbone_shapesl * backbone_shapesl
    anchors_per_level.append(anchors_per_cell  num_cells // config.RPN_ANCHOR_STRIDE*2)
    print("Anchors in Level {}: {}".format(l, anchors_per_level[l]))


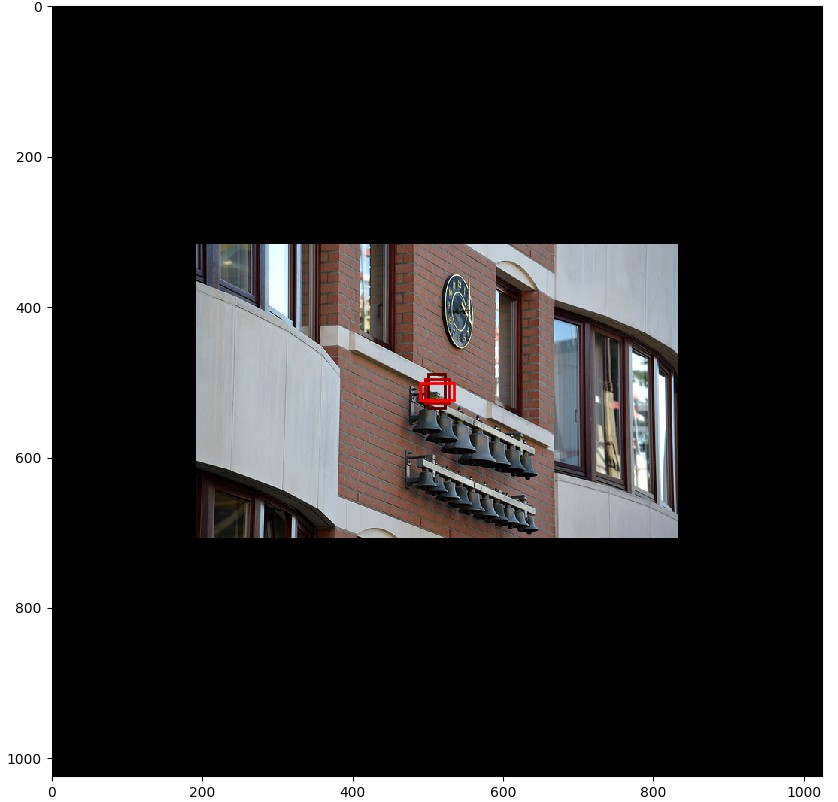
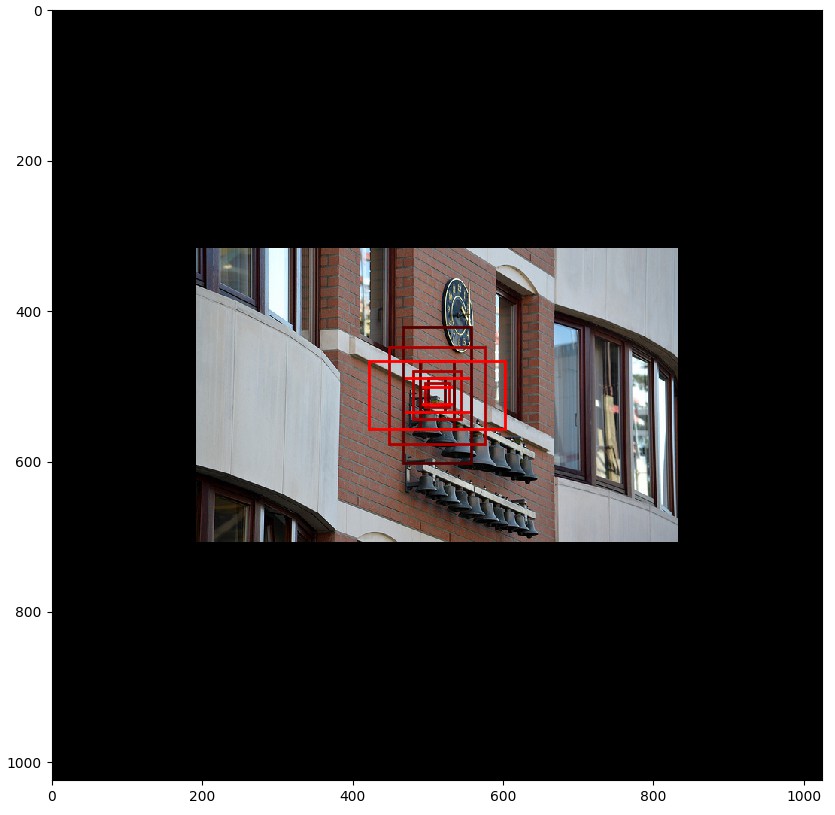
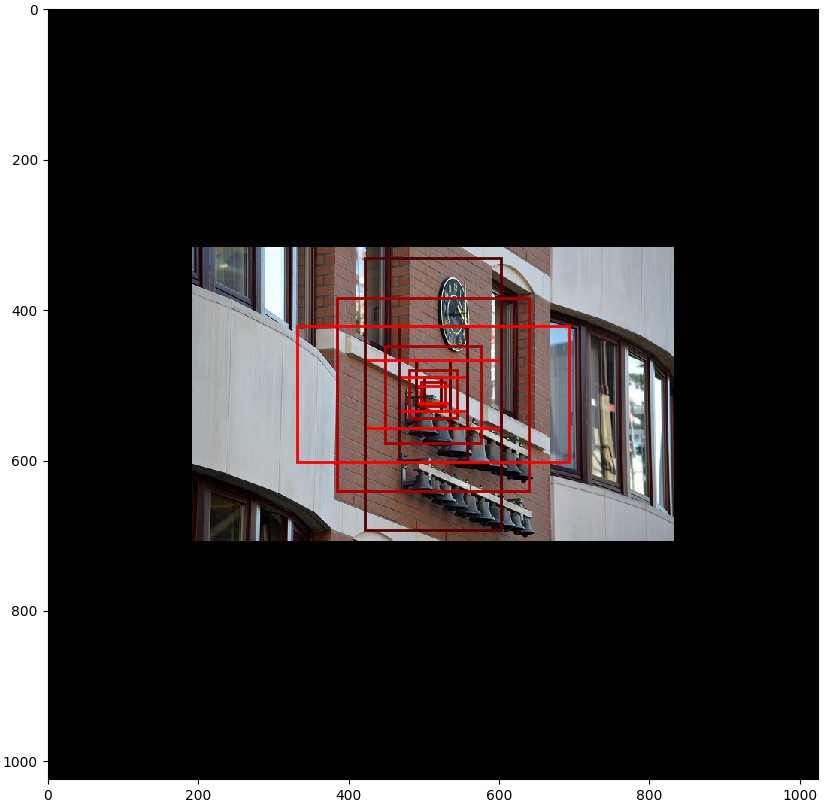
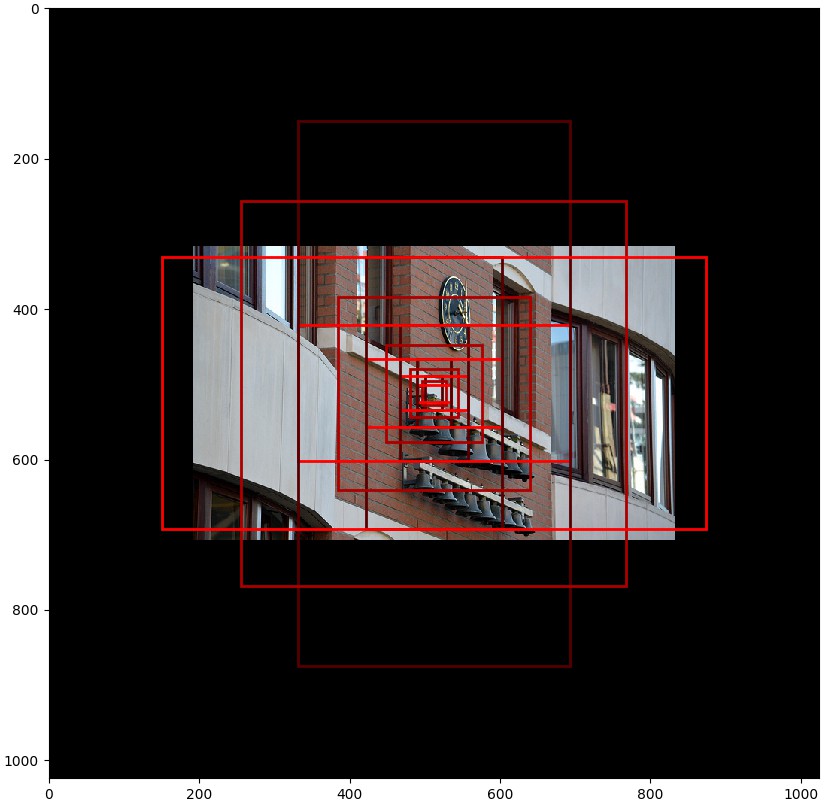
# 可视化在某个特定层的 feature map 中心的单元格的 anchors.
# Load and draw random image
image_id = np.random.choice(dataset.image_ids, 1)[0]
image, image_meta, , _,  = modellib.load_image_gt(dataset, config, image_id)
fig, ax = plt.subplots(1, figsize=(10, 10))
ax.imshow(image)
levels = len(backbone_shapes)

for level in range(levels):
    colors = visualize.random_colors(levels)
    # 计算在图片中心的 anchors 的索引
    level_start = sum(anchors_per_level[:level]) # 先前层的 anchors 相加和 sum of anchors of previous levels
    level_anchors = anchors[level_start:level_start+anchors_per_level[level]]
    print("Level {}. Anchors: {:6}  Feature map Shape: {}".format(level, level_anchors.shape[0],
                                                                  backbone_shapes[level]))
    center_cell = backbone_shapes[level] // 2
    center_cell_index = (center_cell[0] * backbone_shapeslevel + center_cell[1])
    level_center = center_cell_index * anchors_per_cell
    center_anchor = anchors_per_cell * (
        (center_cell[0]  backbone_shapeslevel / config.RPN_ANCHOR_STRIDE*2) \
        + center_cell[1] / config.RPN_ANCHOR_STRIDE)
    level_center = int(center_anchor)

    # 画出 anchors.
    # Brightness show the order in the array, dark to bright.
    for i, rect in enumerate(level_anchors[level_center:level_center+anchors_per_cell]):
        y1, x1, y2, x2 = rect
        p = patches.Rectangle((x1, y1), x2-x1, y2-y1, linewidth=2, facecolor='none',
                              edgecolor=(i+1)*np.array(colors[level]) / anchors_per_cell)
        ax.add_patch(p)
('Count: ', 261888) ('Scales: ', (32, 64, 128, 256, 512)) ('ratios: ', [0.5, 1, 2]) ('Anchors per Cell: ', 3) ('Levels: ', 5) Anchors in Level 0: 196608 Anchors in Level 1: 49152 Anchors in Level 2: 12288 Anchors in Level 3: 3072 Anchors in Level 4: 768 Level 0. Anchors: 196608 Feature map Shape: [256 256] Level 1. Anchors: 49152 Feature map Shape: [128 128] Level 2. Anchors: 12288 Feature map Shape: [64 64] Level 3. Anchors: 3072 Feature map Shape: [32 32] Level 4. Anchors: 768 Feature map Shape: [16 16]
- Data Generator 数据生成
###############################################
# Data Generator 数据生成
###############################################

# Create data generator
random_rois = 2000
g = modellib.data_generator(dataset, config, shuffle=True, random_rois=random_rois,
                            batch_size=4, detection_targets=True)

# Uncomment to run the generator through a lot of images
# to catch rare errors
# for i in range(1000):
#     print(i)
#     ,  = next(g)

# Get Next Image
if random_rois:
    [normalized_images, image_meta, rpn_match, rpn_bbox, gt_class_ids, gt_boxes,
     gt_masks, rpn_rois, rois], [mrcnn_class_ids, mrcnn_bbox, mrcnn_mask] = next(g)

    log("rois", rois)
    log("mrcnn_class_ids", mrcnn_class_ids)
    log("mrcnn_bbox", mrcnn_bbox)
    log("mrcnn_mask", mrcnn_mask)
else:
    [normalized_images, image_meta, rpn_match, rpn_bbox, gt_boxes, gt_masks], _ = next(g)

log("gt_class_ids", gt_class_ids)
log("gt_boxes", gt_boxes)
log("gt_masks", gt_masks)
log("rpn_match", rpn_match, )
log("rpn_bbox", rpn_bbox)
image_id = modellib.parse_image_meta(image_meta)"image_id"
print("image_id: ", image_id, dataset.image_reference(image_id))

# Remove the last dim in mrcnn_class_ids. It's only added
# to satisfy Keras restriction on target shape.
mrcnn_class_ids = mrcnn_class_ids[:, :, 0]

b = 0
# Restore original image (reverse normalization)
sample_image = modellib.unmold_image(normalized_images[b], config)

# Compute anchor shifts.
indices = np.where(rpn_match[b] == 1)[0]
refined_anchors = utils.apply_box_deltas(anchors[indices], rpn_bbox[b, :len(indices)] * config.RPN_BBOX_STD_DEV)
log("anchors", anchors)
log("refined_anchors", refined_anchors)


# Get list of positive anchors
positive_anchor_ids = np.where(rpn_match[b] == 1)[0]
print("Positive anchors: {}".format(len(positive_anchor_ids)))
negative_anchor_ids = np.where(rpn_match[b] == -1)[0]
print("Negative anchors: {}".format(len(negative_anchor_ids)))
neutral_anchor_ids = np.where(rpn_match[b] == 0)[0]
print("Neutral anchors: {}".format(len(neutral_anchor_ids)))

# ROI breakdown by class
for c, n in zip(dataset.class_names, np.bincount(mrcnn_class_ids[b].flatten())):
    if n:
        print("{:23}: {}".format(c[:20], n))
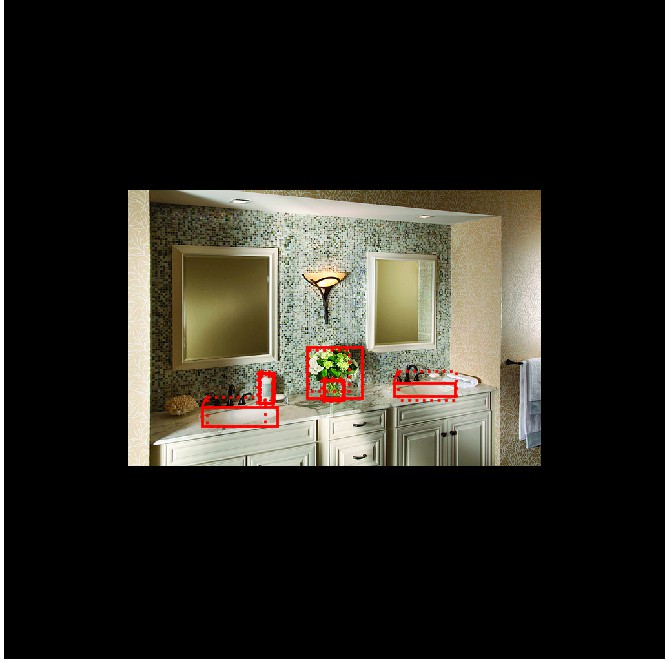
rois shape: (4, 200, 4) min: 0.00000 max: 1023.00000 int32 mrcnn_class_ids shape: (4, 200, 1) min: 0.00000 max: 0.00000 int32 mrcnn_bbox shape: (4, 200, 81, 4) min: 0.00000 max: 0.00000 float32 mrcnn_mask shape: (4, 200, 28, 28, 81) min: 0.00000 max: 0.00000 float32 gt_class_ids shape: (4, 100) min: 0.00000 max: 76.00000 int32 gt_boxes shape: (4, 100, 4) min: 0.00000 max: 832.00000 int32 gt_masks shape: (4, 56, 56, 100) min: 0.00000 max: 1.00000 bool rpn_match shape: (4, 261888, 1) min: -1.00000 max: 1.00000 int32 rpn_bbox shape: (4, 256, 4) min: -3.83894 max: 1.98054 float64 ('image_id: ', 14422, 'http://cocodataset.org/#explore?id=549836') anchors shape: (261888, 4) min: -362.03867 max: 1322.03867 float64 refined_anchors shape: (10, 4) min: 307.00000 max: 700.00000 float32 Positive anchors: 10 Negative anchors: 246 Neutral anchors: 261632 BG : 200# Show positive anchors visualize.draw_boxes(sample_image, boxes=anchors[positive_anchor_ids], refined_boxes=refined_anchors)
# Show negative anchors
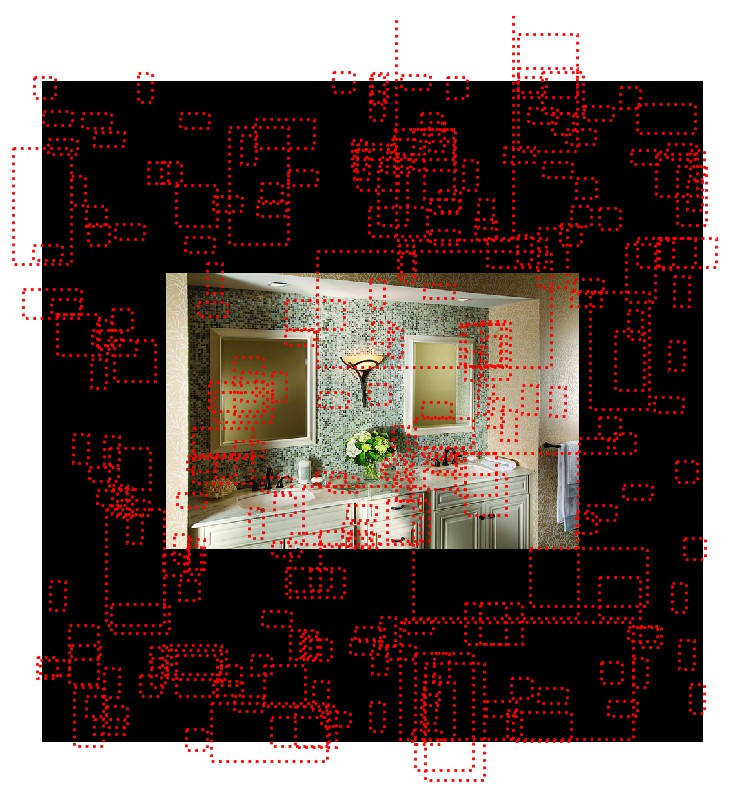
visualize.draw_boxes(sample_image, boxes=anchors[negative_anchor_ids])
# Show neutral anchors. 不用于训练
visualize.draw_boxes(sample_image, boxes=anchors[np.random.choice(neutral_anchor_ids, 100)])
- ROIs
###############################################
# ROIs
###############################################

if random_rois:
    # Class aware bboxes
    bbox_specific = mrcnn_bbox[b, np.arange(mrcnn_bbox.shape[1]),
                    mrcnn_class_ids[b], :]

    # Refined ROIs
    refined_rois = utils.apply_box_deltas(rois[b].astype(np.float32),
                                          bbox_specific[:,
                                          :4] * config.BBOX_STD_DEV)

    # Class aware masks
    mask_specific = mrcnn_mask[b, np.arange(mrcnn_mask.shape[1]), :, :,
                    mrcnn_class_ids[b]]

    visualize.draw_rois(sample_image, rois[b], refined_rois, mask_specific,
                        mrcnn_class_ids[b], dataset.class_names)

    # Any repeated ROIs?
    rows = np.ascontiguousarray(rois[b]).view(
        np.dtype((np.void, rois.dtype.itemsize * rois.shape[-1])))
    _, idx = np.unique(rows, return_index=True)
    print("Unique ROIs: {} out of {}".format(len(idx), rois.shape[1]))


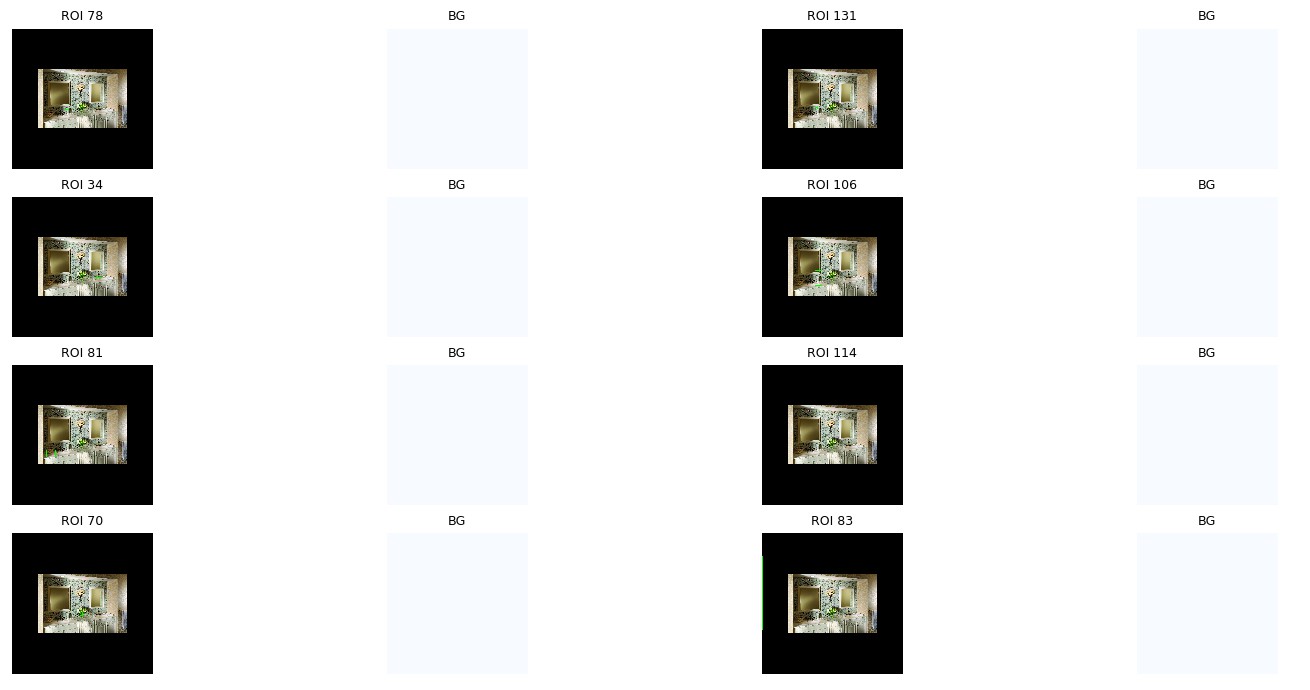
if random_rois:
    # Dispalay ROIs and corresponding masks and bounding boxes
    ids = random.sample(range(rois.shape[1]), 8)

    images = []
    titles = []
    for i in ids:
        image = visualize.draw_box(sample_image.copy(), rois[b,i,:4].astype(np.int32), [255, 0, 0])
        image = visualize.draw_box(image, refined_rois[i].astype(np.int64), [0, 255, 0])
        images.append(image)
        titles.append("ROI {}".format(i))
        images.append(mask_specific[i] * 255)
        titles.append(dataset.class_names[mrcnn_class_ids[b,i]][:20])

    display_images(images, titles, cols=4, cmap="Blues", interpolation="none")


# Check ratio of positive ROIs in a set of images.
if random_rois:
    limit = 10
    temp_g = modellib.data_generator(
        dataset, config, shuffle=True, random_rois=10000,
        batch_size=1, detection_targets=True)
    total = 0
    for i in range(limit):
        _, [ids, _, _] = next(temp_g)
        positive_rois = np.sum(ids[0] > 0)
        total += positive_rois
        print("{:5} {:5.2f}".format(positive_rois, positive_rois/ids.shape[1]))
    print("Average percent: {:.2f}".format(total/(limit*ids.shape[1])))
('Positive ROIs: ', 0) ('Negative ROIs: ', 200) Positive Ratio: 0.00 Unique ROIs: 200 out of 200 0 0.00 0 0.00 0 0.00 0 0.00 0 0.00 0 0.00 0 0.00 0 0.00 0 0.00 0 0.00 Average percent: 0.00


