Python图像处理库 - Albumentations,可用于深度学习中网络训练时的图片数据增强.
Github - Albumentations
帮助文档Document - albumentations
Albumentations 图像数据增强库特点:
- 基于高度优化的 OpenCV 库实现图像快速数据增强.
- 针对不同图像任务,如分割,检测等,超级简单的 API 接口.
- 易于个性化定制.
- 易于添加到其它框架,比如 PyTorch.
1. Albumentations 的 pip 安装
sudo pip install albumentations
# 或
sudo pip install -U git+https://github.com/albu/albumentations
2. 不同图片数据增强库对比
albumentations/benchmark/README.md
对 ImageNet validation set 中的前 2000 张图片进行处理,采用 Intel Core i7-7800X CPU.
不同数据增强库的处理速度对比(以秒为单位,时间越少越好).
3. 使用示例
example.ipynb
import numpy as np
import cv2
from matplotlib import pyplot as plt

from  albumentations  import (
    HorizontalFlip, IAAPerspective, ShiftScaleRotate, CLAHE, RandomRotate90,
    Transpose, ShiftScaleRotate, Blur, OpticalDistortion, GridDistortion, HueSaturationValue,
    IAAAdditiveGaussianNoise, GaussNoise, MotionBlur, MedianBlur, IAAPiecewiseAffine,
    IAASharpen, IAAEmboss, RandomContrast, RandomBrightness, Flip, OneOf, Compose
) # 图像变换函数

image = cv2.imread('test.jpg', 1) # BGR
image = cv2.cvtColor(image, cv2.COLOR_BGR2RGB)

aug = HorizontalFlip(p=1)
img_HorizontalFlip = aug(image=image)['image']

aug = IAAPerspective(scale=0.2, p=1)
img_IAAPerspective = aug(image=image)['image']

aug = ShiftScaleRotate(p=1)
img_ShiftScaleRotate = aug(image=image)['image']

def  augment_flips_color(p=.5):
    return Compose([
        CLAHE(),
        RandomRotate90(),
        Transpose(),
        ShiftScaleRotate(shift_limit=0.0625, scale_limit=0.50, rotate_limit=45, p=.75),
        Blur(blur_limit=3),
        OpticalDistortion(),
        GridDistortion(),
        HueSaturationValue()
    ], p=p)

aug = augment_flips_color(p=1)
img_augment_flips_color = aug(image=image)['image']

def strong_aug(p=.5):
    return Compose([
        RandomRotate90(),
        Flip(),
        Transpose(),
        OneOf([
            IAAAdditiveGaussianNoise(),
            GaussNoise(),
        ], p=0.2),
        OneOf([
            MotionBlur(p=.2),
            MedianBlur(blur_limit=3, p=.1),
            Blur(blur_limit=3, p=.1),
        ], p=0.2),
        ShiftScaleRotate(shift_limit=0.0625, scale_limit=0.2, rotate_limit=45, p=.2),
        OneOf([
            OpticalDistortion(p=0.3),
            GridDistortion(p=.1),
            IAAPiecewiseAffine(p=0.3),
        ], p=0.2),
        OneOf([
            CLAHE(clip_limit=2),
            IAASharpen(),
            IAAEmboss(),
            RandomContrast(),
            RandomBrightness(),
        ], p=0.3),
        HueSaturationValue(p=0.3),
    ], p=p)

aug  ==  strong_aug(p=1)
img_strong_aug = aug(image=image)['image']

# show
plt.subplot(2, 3, 1)
plt.imshow(image)
plt.subplot(2, 3, 2)
plt.imshow(img_HorizontalFlip)
plt.subplot(2, 3, 3)
plt.imshow(img_IAAPerspective)
plt.subplot(2, 3, 4)
plt.imshow(img_ShiftScaleRotate)
plt.subplot(2, 3, 5)
plt.imshow(img_augment_flips_color)
plt.subplot(2, 3, 6)
plt.imshow(img_strong_aug)
plt.show()
from albumentations import (
    RandomRotate90, Transpose, ShiftScaleRotate, Blur,
    OpticalDistortion, CLAHE, GaussNoise, MotionBlur,
    GridDistortion, HueSaturationValue, IAAAdditiveGaussianNoise,
    MedianBlur, IAAPiecewiseAffine, IAASharpen, IAAEmboss,
    RandomContrast, RandomBrightness, Flip, OneOf, Compose
)
import numpy as np

def strong_aug(p=0.5):
    return Compose([
        RandomRotate90(),
        Flip(),
        Transpose(),
        OneOf([
            IAAAdditiveGaussianNoise(),
            GaussNoise(),
        ], p=0.2),
        OneOf([
            MotionBlur(p=0.2),
            MedianBlur(blur_limit=3, p=0.1),
            Blur(blur_limit=3, p=0.1),
        ], p=0.2),
        ShiftScaleRotate(shift_limit=0.0625, scale_limit=0.2, rotate_limit=45, p=0.2),
        OneOf([
            OpticalDistortion(p=0.3),
            GridDistortion(p=0.1),
            IAAPiecewiseAffine(p=0.3),
        ], p=0.2),
        OneOf([
            CLAHE(clip_limit=2),
            IAASharpen(),
            IAAEmboss(),
            RandomContrast(),
            RandomBrightness(),
        ], p=0.3),
        HueSaturationValue(p=0.3),
    ], p=p)

image = np.ones((300, 300, 3), dtype=np.uint8)
mask = np.ones((300, 300), dtype=np.uint8)
whatever_data = "my name"
augmentation = strong_aug(p=0.9)
data = {"image": image, "mask": mask, "whatever_data": whatever_data, "additional": "hello"}
augmented = augmentation(**data)  ## 数据增强
image, mask, whatever_data, additional = augmented["image"], augmented["mask"], augmented["whatever_data"], augmented["additional"]
4. 更新的使用示例
2018.10.24 更
Github - Albumentations 更新了几个关于 albumentations 的使用 Demo.
4.1 综合示例 - showcase
showcase.ipynb
# 导入相关库,并定义用于可视化的函数
#!--*-- coding: utf-8 --*--
import os

import numpy as np
import cv2
from matplotlib import pyplot as plt
from skimage.color import label2rgb

import albumentations as A
import random

BOX_COLOR = (255, 0, 0)
TEXT_COLOR = (255, 255, 255)

def visualize_bbox(img, bbox, color=BOX_COLOR, thickness=2, **kwargs):
    #height, width = img.shape[:2]
    x_min, y_min, w, h = bbox
    x_min, x_max, y_min, y_max = int(x_min), int(x_min + w), int(y_min), int(y_min + h)

    cv2.rectangle(img, (x_min, y_min), (x_max, y_max), color=color, thickness=thickness)
    return img

def visualize_titles(img, bbox, title, color=BOX_COLOR, thickness=2, font_thickness = 2, font_scale=0.35, **kwargs):
    #height, width = img.shape[:2]
    x_min, y_min, w, h = bbox
    x_min, x_max, y_min, y_max = int(x_min), int(x_min + w), int(y_min), int(y_min + h)

    ((text_width, text_height), _) = cv2.getTextSize(title, cv2.FONT_HERSHEY_SIMPLEX, font_scale, font_thickness)
    cv2.rectangle(img, (x_min, y_min - int(1.3 * text_height)), (x_min + text_width, y_min), BOX_COLOR, -1)
    cv2.putText(img, title, (x_min, y_min - int(0.3 * text_height)), cv2.FONT_HERSHEY_SIMPLEX, font_scale, TEXT_COLOR,
                font_thickness, lineType=cv2.LINE_AA)
    return img


def augment_and_show(aug, image, mask=None, bboxes=[],
                     categories=[], category_id_to_name=[], filename=None,
                     font_scale_orig=0.35, font_scale_aug=0.35,
                     show_title=True, **kwargs):

    augmented = aug(image=image, mask=mask, bboxes=bboxes, category_id=categories)

    image = cv2.cvtColor(image, cv2.COLOR_BGR2RGB)
    image_aug = cv2.cvtColor(augmented['image'], cv2.COLOR_BGR2RGB)

    for bbox in bboxes:
        visualize_bbox(image, bbox, **kwargs)

    for bbox in augmented['bboxes']:
        visualize_bbox(image_aug, bbox, **kwargs)

    if show_title:
        for bbox,cat_id in zip(bboxes, categories):
            visualize_titles(image, bbox, category_id_to_name[cat_id], font_scale=font_scale_orig, **kwargs)
        for bbox,cat_id in zip(augmented['bboxes'], augmented['category_id']):
            visualize_titles(image_aug, bbox, category_id_to_name[cat_id], font_scale=font_scale_aug, **kwargs)


    if mask is None:
        f, ax = plt.subplots(1, 2, figsize=(16, 8))

        ax[0].imshow(image)
        ax[0].set_title('Original image')

        ax[1].imshow(image_aug)
        ax[1].set_title('Augmented image')
    else:
        f, ax = plt.subplots(2, 2, figsize=(16, 16))

        if len(mask.shape) != 3:
            mask = label2rgb(mask, bg_label=0)
            mask_aug = label2rgb(augmented['mask'], bg_label=0)
        else:
            mask = cv2.cvtColor(mask, cv2.COLOR_BGR2RGB)
            mask_aug = cv2.cvtColor(augmented['mask'], cv2.COLOR_BGR2RGB)

        ax[0, 0].imshow(image)
        ax[0, 0].set_title('Original image')

        ax[0, 1].imshow(image_aug)
        ax[0, 1].set_title('Augmented image')

        ax[1, 0].imshow(mask, interpolation='nearest')
        ax[1, 0].set_title('Original mask')

        ax[1, 1].imshow(mask_aug, interpolation='nearest')
        ax[1, 1].set_title('Augmented mask')

    f.tight_layout()
    plt.show()

    if filename is not None:
        f.savefig(filename)

    return augmented['image'], augmented['mask'], augmented['bboxes']


def find_in_dir(dirname):
    return [os.path.join(dirname, fname) for fname in sorted(os.listdir(dirname))]
颜色增强 - Color Augmentations
# 颜色增强处理函数

random.seed(42)
image = cv2.imread('images/parrot.jpg')

light = A.Compose([
    A.RandomBrightness(p=1),
    A.RandomContrast(p=1),
    A.RandomGamma(p=1),
#     A.RGBShift(),
    A.CLAHE(p=1),
#     A.ToGray(),
#     A.HueSaturationValue(),
], p=1)

medium = A.Compose([
    A.CLAHE(p=1),
    A.HueSaturationValue(hue_shift_limit=20, sat_shift_limit=50, val_shift_limit=50, p=1),
], p=1)


strong = A.Compose([
    A.ChannelShuffle(p=1),
], p=1)
颜色增强 - light:
res = augment_and_show(light, image) 
颜色增强 - medium:
res = augment_and_show(medium, image)
颜色增强 - strong:
res = augment_and_show(strong, image) 
航空遥感图像 - Inria Aerial Image Labeling Dataset
random.seed(42)

image = cv2.imread('images/inria/inria_tyrol_w4_image.jpg')
mask = cv2.imread('images/inria/inria_tyrol_w4_mask.tif', cv2.IMREAD_GRAYSCALE)
image, mask = image[:1024, :1024], mask[:1024,:1024]

light = A.Compose([
    A.RandomSizedCrop((512-100, 512+100), 512, 512),
    A.ShiftScaleRotate(),
    A.RGBShift(),
    A.Blur(),
    A.GaussNoise(),
    A.ElasticTransform(),
    A.Cutout(p=1)
],p=1)

res = augment_and_show(light, image, mask)
细胞核分割 - 2018 Data Science Bowl
random.seed(42)

image = cv2.imread('images/dsb2018/1a11552569160f0b1ea10bedbd628ce6c14f29edec5092034c2309c556df833e/images/1a11552569160f0b1ea10bedbd628ce6c14f29edec5092034c2309c556df833e.png')
masks = [cv2.imread(x, cv2.IMREAD_GRAYSCALE) for x in find_in_dir('images/dsb2018/1a11552569160f0b1ea10bedbd628ce6c14f29edec5092034c2309c556df833e/masks')]
bboxes = [cv2.boundingRect(cv2.findNonZero(mask)) for mask in masks]
label_image = np.zeros_like(masks[0])
for i, mask in enumerate(masks):
    label_image += (mask > 0).astype(np.uint8) * i

light = A.Compose([
    A.RGBShift(),
    A.InvertImg(),
    A.Blur(),
    A.GaussNoise(),
    A.Flip(),
    A.RandomRotate90(),
    A.RandomSizedCrop((512 - 100, 512 + 100), 512, 512),
], bbox_params={'format':'coco', 'min_area': 1, 'min_visibility': 0.5, 'label_fields': ['category_id']}, p=1)

label_ids = [0] * len(bboxes)
label_names = ['Nuclei']

res = augment_and_show(light, image, label_image, bboxes, label_ids, label_names, show_title=False)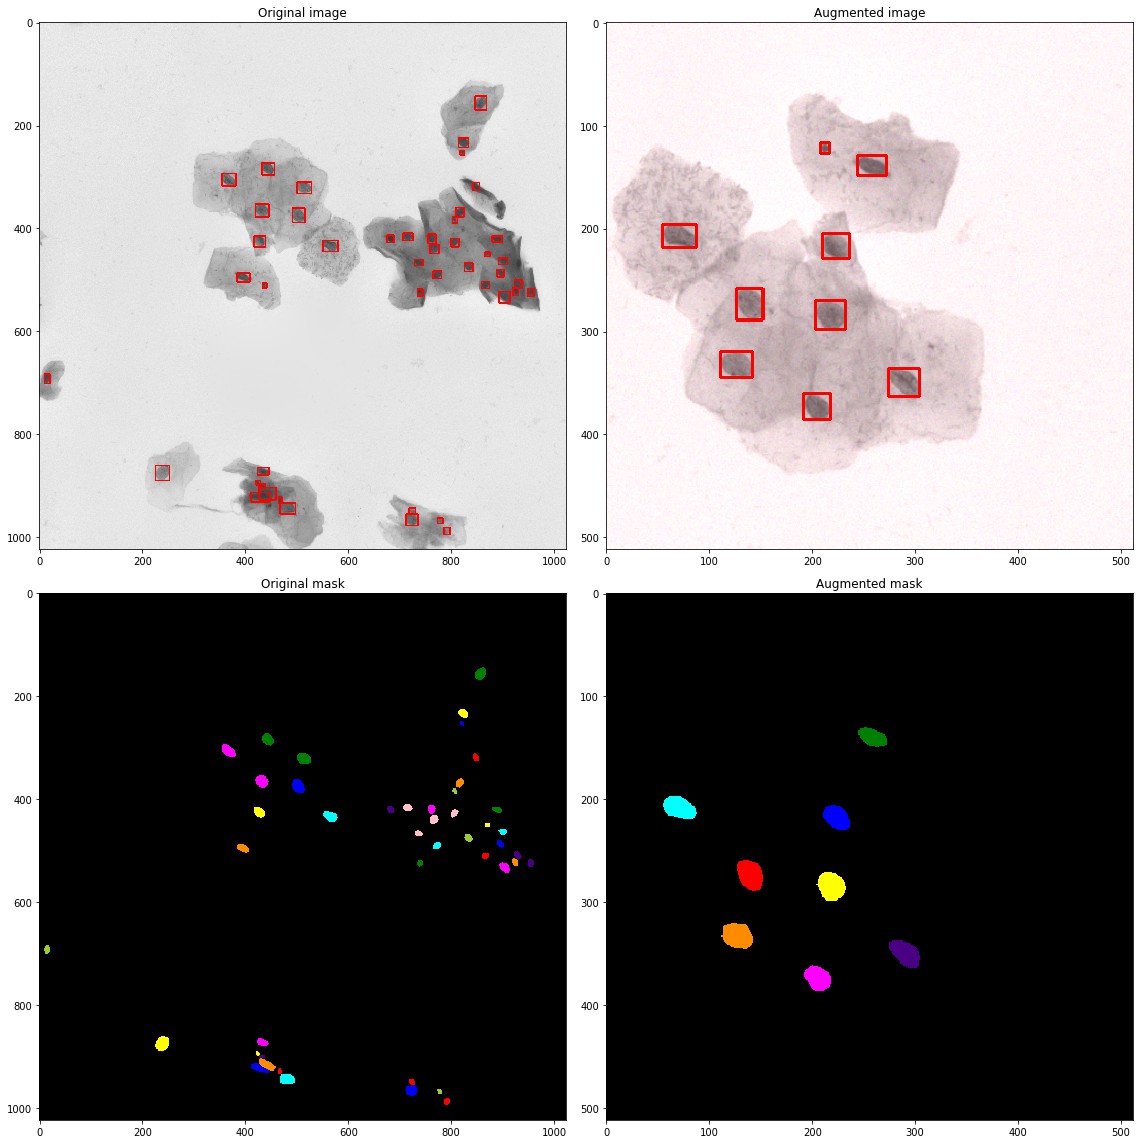
街景数据 - Mapilary Vistas
from PIL import Image

image = cv2.imread('images/vistas/_HnWguqEbRCphUquTMrCCA.jpg')
labels = cv2.imread('images/vistas/_HnWguqEbRCphUquTMrCCA_labels.png', cv2.IMREAD_COLOR)
instances = np.array(Image.open('images/vistas/_HnWguqEbRCphUquTMrCCA_instances.png'),dtype=np.uint16)
IGNORED = 65 * 256

instances[(instances//256 != 55) & (instances//256 != 44) & (instances//256 != 50)] = IGNORED

image = image[1000:2500, 1000:2500]
labels = labels[1000:2500, 1000:2500]
instances = instances[1000:2500, 1000:2500]

bboxes = [cv2.boundingRect(cv2.findNonZero((instances == instance_id).astype(np.uint8))) for instance_id in np.unique(instances) if instance_id != IGNORED]
instance_labels = [instance_id // 256 for instance_id in np.unique(instances) if instance_id != IGNORED]

# coco_bboxes = [list(bbox) + [label] for bbox, label in zip(bboxes, instance_labels)]
# coco_bboxes = A.convert_bboxes_to_albumentations(image.shape, coco_bboxes, source_format='coco')

titles = ["Bird",
"Ground Animal",
"Curb",
"Fence",
"Guard Rail",
"Barrier",
"Wall",
"Bike Lane",
"Crosswalk - Plain",
"Curb Cut",
"Parking",
"Pedestrian Area",
"Rail Track",
"Road",
"Service Lane",
"Sidewalk",
"Bridge",
"Building",
"Tunnel",
"Person",
"Bicyclist",
"Motorcyclist",
"Other Rider",
"Lane Marking - Crosswalk",
"Lane Marking - General",
"Mountain",
"Sand",
"Sky",
"Snow",
"Terrain",
"Vegetation",
"Water",
"Banner",
"Bench",
"Bike Rack",
"Billboard",
"Catch Basin",
"CCTV Camera",
"Fire Hydrant",
"Junction Box",
"Mailbox",
"Manhole",
"Phone Booth",
"Pothole",
"Street Light",
"Pole",
"Traffic Sign Frame",
"Utility Pole",
"Traffic Light",
"Traffic Sign (Back)",
"Traffic Sign (Front)",
"Trash Can",
"Bicycle",
"Boat",
"Bus",
"Car",
"Caravan",
"Motorcycle",
"On Rails",
"Other Vehicle",
"Trailer",
"Truck",
"Wheeled Slow",
"Car Mount",
"Ego Vehicle",
"Unlabeled"]

light = A.Compose([
    A.HorizontalFlip(p=1),
    A.RandomSizedCrop((800 - 100, 800 + 100), 600, 600),
    A.GaussNoise(var_limit=(100, 150), p=1),
], bbox_params={'format':'coco', 'min_area': 1, 'min_visibility': 0.5, 'label_fields': ['category_id']},  p=1)

medium = A.Compose([
    A.HorizontalFlip(p=1),
    A.RandomSizedCrop((800 - 100, 800 + 100), 600, 600),
    A.MotionBlur(blur_limit=37, p=1),
], bbox_params={'format':'coco', 'min_area': 1, 'min_visibility': 0.5, 'label_fields': ['category_id']}, p=1)


strong = A.Compose([
    A.HorizontalFlip(p=1),
    A.RandomSizedCrop((800 - 100, 800 + 100), 600, 600),
    A.RGBShift(p=1),
    A.Blur(blur_limit=11, p=1),
    A.RandomBrightness(p=1),
    A.CLAHE(p=1),
], bbox_params={'format':'coco', 'min_area': 1, 'min_visibility': 0.5, 'label_fields': ['category_id']}, p=1)
街景数据增强 - light:
random.seed(13)
res = augment_and_show(light, image, labels, bboxes,
                       instance_labels, titles, thickness=2,
                       font_scale_orig=2, font_scale_aug=1)
街景数据增强 - medium:
random.seed(13)
res = augment_and_show(medium, image, labels, bboxes,
                       instance_labels, titles, thickness=2,
                       font_scale_orig=2, font_scale_aug=1)
街景数据增强 - strong:
random.seed(13)
res = augment_and_show(strong, image, labels, bboxes,
                       instance_labels, titles, thickness=2,
                       font_scale_orig=2, font_scale_aug=1)
4.2 分类 Classification 示例
examplt.ipynb
import numpy as np
import cv2
import matplotlib.pyplot as plt

from albumentations import (
    HorizontalFlip, IAAPerspective, ShiftScaleRotate, CLAHE,
    RandomRotate90, Transpose, ShiftScaleRotate, Blur,
    OpticalDistortion, GridDistortion, HueSaturationValue,
    IAAAdditiveGaussianNoise, GaussNoise, MotionBlur, MedianBlur,
    IAAPiecewiseAffine, IAASharpen, IAAEmboss, RandomContrast,
    RandomBrightness, Flip, OneOf, Compose
)


def augment_and_show(aug, image):
    image = aug(image=image)['image']
    plt.figure(figsize=(10, 10))
    plt.imshow(image)

image = cv2.imread('test.jpg')
image = cv2.cvtColor(image, cv2.COLOR_BGR2RGB)

plt.subplot(2, 2, 1)
plt.imshow(image)

plt.subplot(2, 2, 2)
aug = HorizontalFlip(p=1)
image_aug1 = aug(image=image)['image']
plt.imshow(image_aug1)

plt.subplot(2, 2, 3)
aug = IAAPerspective(scale=0.2, p=1)
image_aug2 = aug(image=image)['image']
plt.imshow(image_aug2)

plt.subplot(2, 2, 4)
aug = ShiftScaleRotate(p=1)
image_aug3 = aug(image=image)['image']
plt.imshow(image_aug3)
plt.show()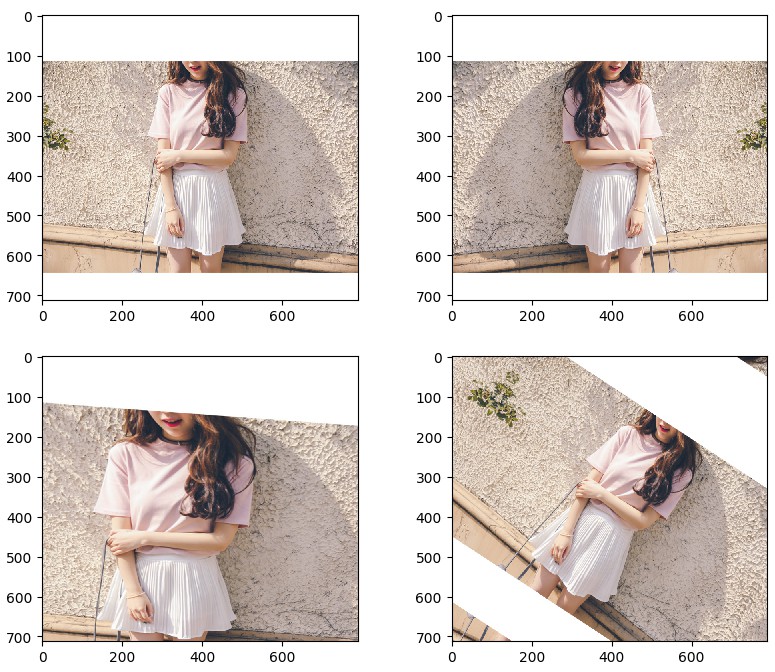
def augment_flips_color(p=.5):
    return Compose([
        CLAHE(),
        RandomRotate90(),
        Transpose(),
        ShiftScaleRotate(shift_limit=0.0625,
                         scale_limit=0.50,
                         rotate_limit=45, p=.75),
        Blur(blur_limit=3),
        OpticalDistortion(),
        GridDistortion(),
        HueSaturationValue()
    ], p=p)


aug = augment_flips_color(p=1)
image_aug = aug(image=image)['image']

plt.subplot(1, 2, 1)
plt.imshow(image)
plt.subplot(1, 2, 2)
plt.imshow(image_aug)
plt.show()
def strong_aug(p=.5):
    return Compose([
        RandomRotate90(),
        Flip(),
        Transpose(),
        OneOf([
            IAAAdditiveGaussianNoise(),
            GaussNoise(),
        ], p=0.2),
        OneOf([
            MotionBlur(p=.2),
            MedianBlur(blur_limit=3, p=.1),
            Blur(blur_limit=3, p=.1),
        ], p=0.2),
        ShiftScaleRotate(shift_limit=0.0625, scale_limit=0.2, rotate_limit=45, p=.2),
        OneOf([
            OpticalDistortion(p=0.3),
            GridDistortion(p=.1),
            IAAPiecewiseAffine(p=0.3),
        ], p=0.2),
        OneOf([
            CLAHE(clip_limit=2),
            IAASharpen(),
            IAAEmboss(),
            RandomContrast(),
            RandomBrightness(),
        ], p=0.3),
        HueSaturationValue(p=0.3),
    ], p=p)

aug = strong_aug(p=1)
image_aug = aug(image=image)['image']

plt.subplot(1, 2, 1)
plt.imshow(image)
plt.subplot(1, 2, 2)
plt.imshow(image_aug)
plt.show()
4.3 检测 Object Detection 示例
example_boxes.ipynb
# 导入相关库,定义可视化函数

import os
import numpy as np
import cv2
from matplotlib import pyplot as plt
from urllib.request import urlopen

from albumentations import (
    HorizontalFlip,
    VerticalFlip,
    Resize,
    CenterCrop,
    RandomCrop,
    Crop,
    Compose
)


# 用于图片上的边界框和类别 labels 的可视化函数
BOX_COLOR = (255, 0, 0)
TEXT_COLOR = (255, 255, 255)

def visualize_bbox(img, bbox, class_id, class_idx_to_name, color=BOX_COLOR, thickness=2):
    x_min, y_min, w, h = bbox
    x_min, x_max, y_min, y_max = int(x_min), int(x_min + w), int(y_min), int(y_min + h)
    cv2.rectangle(img, (x_min, y_min), (x_max, y_max), color=color, thickness=thickness)
    class_name = class_idx_to_name[class_id]
    ((text_width, text_height), _) = cv2.getTextSize(class_name, cv2.FONT_HERSHEY_SIMPLEX, 0.35, 1)
    cv2.rectangle(img, (x_min, y_min - int(1.3 * text_height)), (x_min + text_width, y_min), BOX_COLOR, -1)
    cv2.putText(img, class_name, (x_min, y_min - int(0.3 * text_height)), cv2.FONT_HERSHEY_SIMPLEX, 0.35,TEXT_COLOR, lineType=cv2.LINE_AA)
    return img


def visualize(annotations, category_id_to_name):
    img = annotations['image'].copy()
    for idx, bbox in enumerate(annotations['bboxes']):
        img = visualize_bbox(img, bbox, annotations['category_id'][idx], category_id_to_name)
    plt.figure(figsize=(12, 12))
    plt.imshow(img)
    plt.imshow()
对于检测问题,必须以指定格式定义 bbox_params. 支持的格式有两种: coco 和 pascal_voc.
coco 的 bounding box 格式为:[x_min, y_min, width, height], e.g. [97, 12, 150, 200].
pascal_voc 的 bounding box 格式为: [x_min, y_min, x_max, y_max], e.g. [97, 12, 247, 212].
def get_aug(aug, min_area=0., min_visibility=0.):
    return Compose(aug, bbox_params={'format': 'coco', 'min_area': min_area, 'min_visibility': min_visibility, 'label_fields': ['category_id']})


def download_image(url):
    data = urlopen(url).read()
    data = np.frombuffer(data, np.uint8)
    image = cv2.imdecode(data, cv2.IMREAD_COLOR)
    image = cv2.cvtColor(image, cv2.COLOR_BGR2RGB)
    return image

image = download_image('http://images.cocodataset.org/train2017/000000386298.jpg')

# Annotations for image 386298 from COCO http://cocodataset.org/#explore?id=386298
annotations = {'image': image, 'bboxes': [[366.7, 80.84, 132.8, 181.84], [5.66, 138.95, 147.09, 164.88]], 'category_id': [18, 17]}
category_id_to_name = {17: 'cat', 18: 'dog'}
可视化原图标注:
visualize(annotations, category_id_to_name)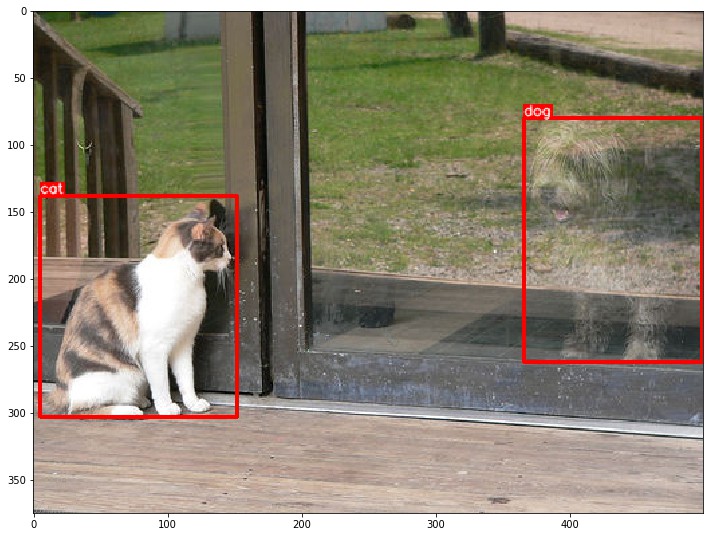
垂直翻转增强:
aug = get_aug([VerticalFlip(p=1)])
augmented = aug(**annotations)
visualize(augmented, category_id_to_name)
水平翻转增强:
aug = get_aug([HorizontalFlip(p=1)])
augmented = aug(**annotations)
visualize(augmented, category_id_to_name)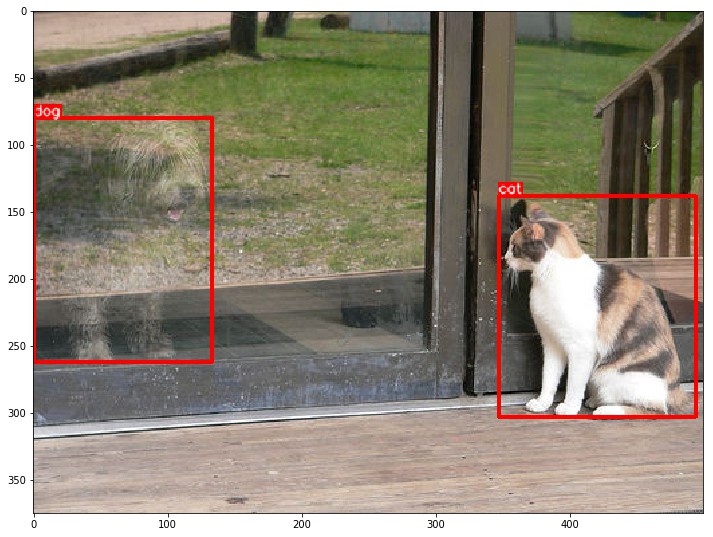
Resize 数据增强:
aug = get_aug([Resize(p=1, height=256, width=256)])
augmented = aug(**annotations)
visualize(augmented, category_id_to_name)
Albumentation 库还支持 boxes 裁剪与删除. 主要包括两个参数:min_aera 和 min_visibility.
默认 min_aera 和 min_visibility 值均为 0,故,只有超出图片尺寸之外的 boxes 才会被删除.
CenterCrop:
aug = get_aug([CenterCrop(p=1, height=300, width=300)])
augmented = aug(**annotations)
visualize(augmented, category_id_to_name)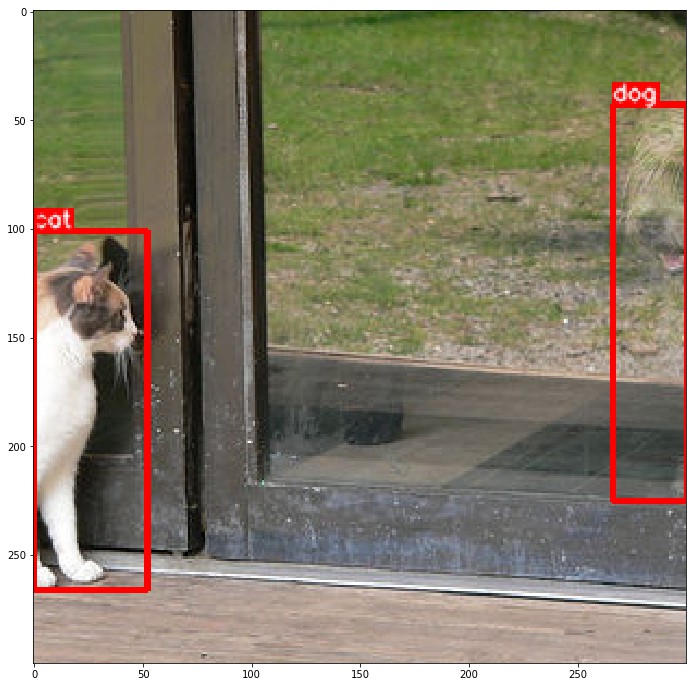
CenterCrop with default filter:
aug = get_aug([CenterCrop(p=1, height=224, width=224)])
augmented = aug(**annotations)
print(augmented['category_id'])
visualize(augmented, category_id_to_name)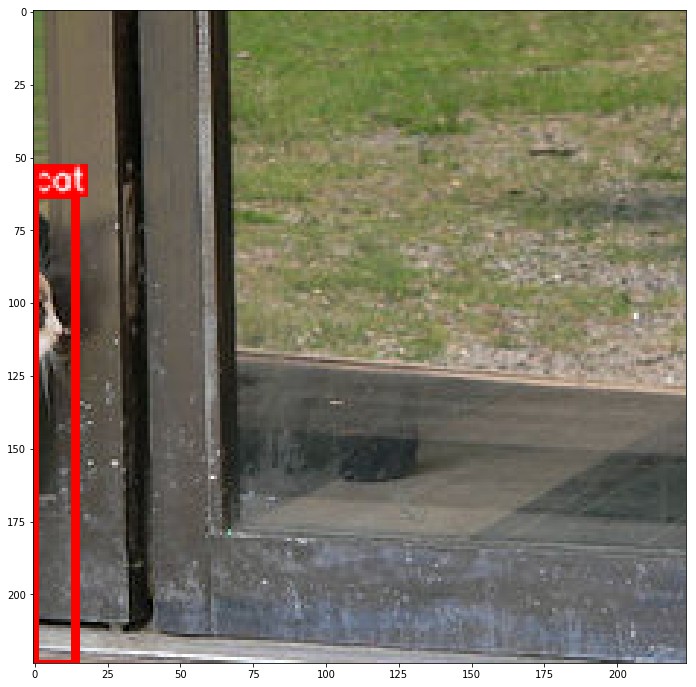
CenterCrop + filter with min_area:
aug = get_aug([CenterCrop(p=1, height=224, width=224)], min_area=4000)
augmented = aug(**annotations)
visualize(augmented, category_id_to_name)
CenterCrop + filter by visibility:
# 只返回变换后可见性大于 threshold 的 boxes
aug = get_aug([CenterCrop(p=1, height=300, width=300)], min_visibility=0.3)
augmented = aug(**annotations)
visualize(augmented, category_id_to_name)

# 如图,变换后,dog 的 box 面积大约是原始 box 的 25%,小于 0.3,故舍弃.
# 变换后,cat 的 box 面积大约是原始 box 的 36%,大于 0.3,故保留.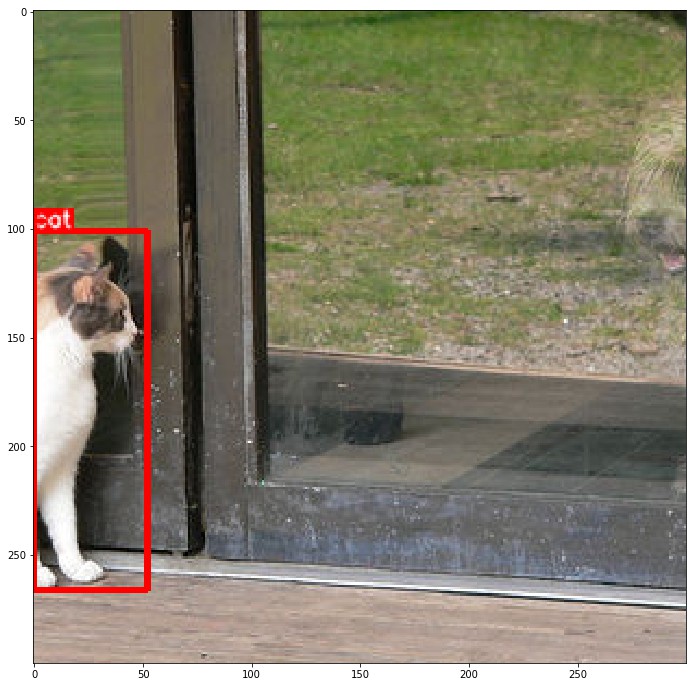
4.3 分割 Segmentation 示例
图片和数据来自: TGS Salt Identification Challenge.
# 导入相关库,定义可视化函数
import numpy as np
import cv2
from matplotlib import pyplot as plt

from albumentations import (
    PadIfNeeded,
    HorizontalFlip,
    VerticalFlip,
    CenterCrop,
    Crop,
    Compose,
    Transpose,
    RandomRotate90,
    ElasticTransform,
    GridDistortion,
    OpticalDistortion,
    RandomSizedCrop,
    OneOf,
    CLAHE,
    RandomContrast,
    RandomGamma,
    RandomBrightness
)


def visualize(image, mask, original_image=None, original_mask=None):
    fontsize = 18

    if original_image is None and original_mask is None:
        f, ax = plt.subplots(2, 1, figsize=(8, 8))

        ax[0].imshow(image)
        ax[1].imshow(mask)
    else:
        f, ax = plt.subplots(2, 2, figsize=(8, 8))

        ax[0, 0].imshow(original_image)
        ax[0, 0].set_title('Original image', fontsize=fontsize)

        ax[1, 0].imshow(original_mask)
        ax[1, 0].set_title('Original mask', fontsize=fontsize)

        ax[0, 1].imshow(image)
        ax[0, 1].set_title('Transformed image', fontsize=fontsize)

        ax[1, 1].imshow(mask)
        ax[1, 1].set_title('Transformed mask', fontsize=fontsize)
    plt.show()


# 原图
image = cv2.imread('images/kaggle_salt/0fea4b5049_image.png')
mask = cv2.imread('images/kaggle_salt/0fea4b5049.png', 0)
print(image.shape, mask.shape)
original_height, original_width = image.shape[:2]
visualize(image, mask)
Padding:
UNet 类型的网络结构要求输入图片的尺寸能够被 $2^N$ 整除,$N$ 是 maxpooling 层的数量.
原始 UNet 结构中,$N=5$,因此,需要将输入图片的尺寸 padding 到最接近能够被 $2^5 = 32$ 整除的尺寸,即 128.
该操作可以采用 PadIfNeeded 变换,其同时对 image 和 mask 的四边进行 pad.
可以指定 padding 的类型,如 zero, constant, reflection. 默认是 reflection.
aug = PadIfNeeded(p=1, min_height=128, min_width=128)
augmented = aug(image=image, mask=mask)

image_padded = augmented['image']
mask_padded = augmented['mask']

print(image_padded.shape, mask_padded.shape)

visualize(image_padded, mask_padded, original_image=image, original_mask=mask)
(128, 128, 3) (128, 128)
CenterCrop 和 Crop:
aug = CenterCrop(p=1, height=original_height, width=original_width)
augmented = aug(image=image_padded, mask=mask_padded)

image_center_cropped = augmented['image']
mask_center_cropped = augmented['mask']

print(image_center_cropped.shape, mask_center_cropped.shape)

assert (image - image_center_cropped).sum() == 0
assert (mask - mask_center_cropped).sum() == 0

visualize(image_padded, mask_padded,
          original_image=image_center_cropped,
          original_mask=mask_center_cropped)
(101, 101, 3) (101, 101)

x_min = (128 - original_width) // 2
y_min = (128 - original_height) // 2

x_max = x_min + original_width
y_max = y_min + original_height

aug = Crop(p=1, x_min=x_min, x_max=x_max, y_min=y_min, y_max=y_max)
augmented = aug(image=image_padded, mask=mask_padded)

image_cropped = augmented['image']
mask_cropped = augmented['mask']

print(image_cropped.shape, mask_cropped.shape)

assert (image - image_cropped).sum() == 0
assert (mask - mask_cropped).sum() == 0

visualize(image_cropped, mask_cropped, original_image=image_padded, original_mask=mask_padded)
无损变换(Non destructive transformations)
对于卫星和遥感图像,医疗图像而言,最好是能够不增加或者损失图片信息,进行图像增强变换.
有 8 种不同的方式来表示平面上的同一个方框.

可以采用 HorizontalFlip, VerticalFlip, Transpose, RandomRotate90 实现这八种数据增强.
水平翻转:
aug = HorizontalFlip(p=1)
augmented = aug(image=image, mask=mask)

image_h_flipped = augmented['image']
mask_h_flipped = augmented['mask']

visualize(image_h_flipped, mask_h_flipped,
          original_image=image, original_mask=mask)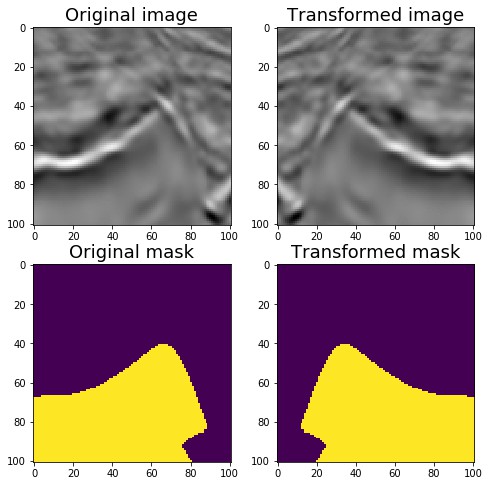
垂直翻转:
aug = VerticalFlip(p=1)
augmented = aug(image=image, mask=mask)

image_v_flipped = augmented['image']
mask_v_flipped = augmented['mask']

visualize(image_v_flipped, mask_v_flipped,
          original_image=image, original_mask=mask)
随机旋转 90 度:
# 随机旋转 0,90,180,270.
aug = RandomRotate90(p=1)
augmented = aug(image=image, mask=mask)

image_rot90 = augmented['image']
mask_rot90 = augmented['mask']

visualize(image_rot90, mask_rot90,
          original_image=image, original_mask=mask)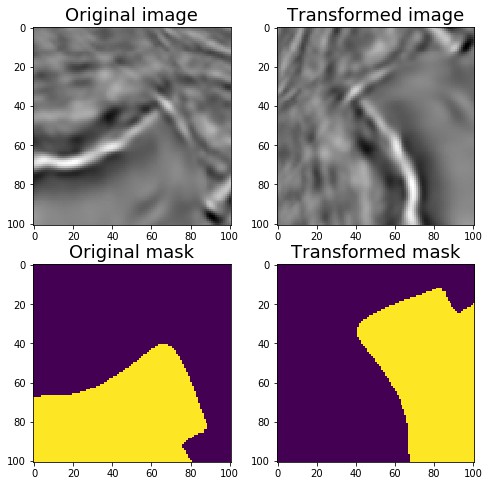
转置 Transpose:
# 交换 X 轴和 Y 轴
aug = Transpose(p=1)
augmented = aug(image=image, mask=mask)

image_transposed = augmented['image']
mask_transposed = augmented['mask']

visualize(image_transposed, mask_transposed,
          original_image=image, original_mask=mask)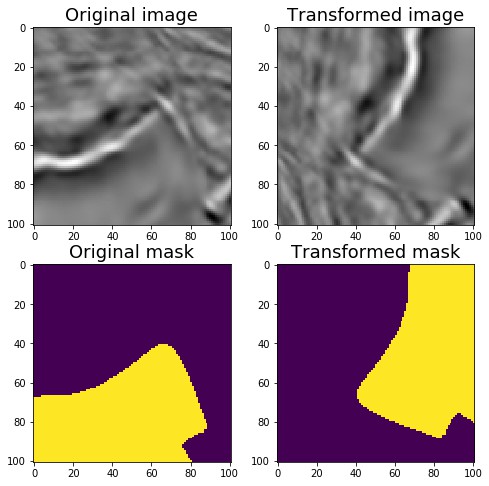
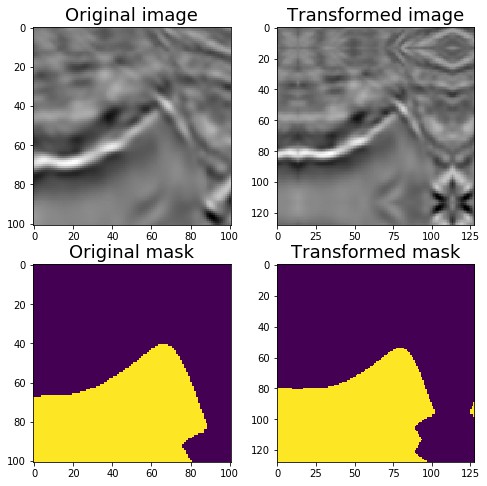
非刚性变换:弹性变换、网格变形、光学畸变(Non-rigid transformations: ElasticTransform, GridDistortion, OpticalDistortion)
在医学图像问题中,非刚性变换有助于数据增强.
弹性变换(ElasticTransform):
aug = ElasticTransform(p=1,
                       alpha=120,
                       sigma=120 * 0.05,
                       alpha_affine=120 * 0.03)
augmented = aug(image=image, mask=mask)

image_elastic = augmented['image']
mask_elastic = augmented['mask']

visualize(image_elastic, mask_elastic,
          original_image=image, original_mask=mask)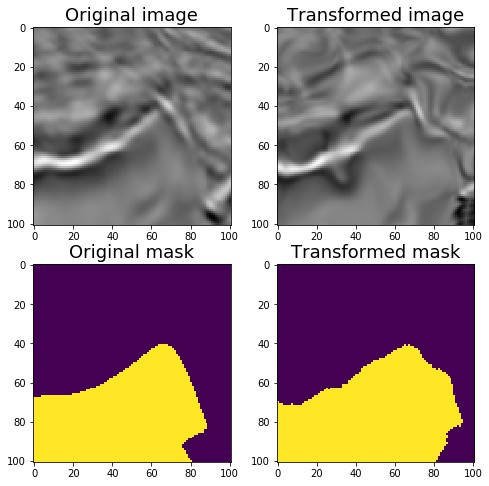
网格变形GridDistortion:
aug = GridDistortion(p=1)
augmented = aug(image=image, mask=mask)

image_grid = augmented['image']
mask_grid = augmented['mask']

visualize(image_grid, mask_grid,
          original_image=image, original_mask=mask)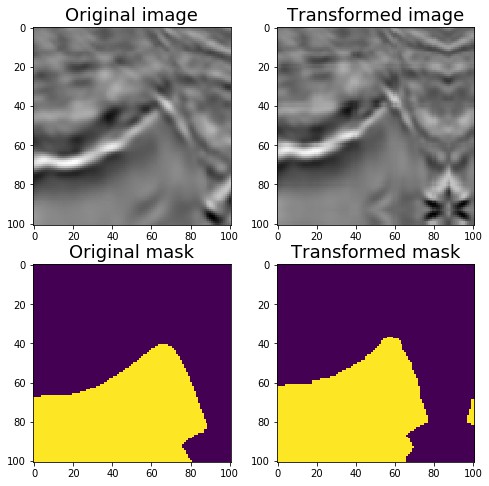
光学畸变OpticalDistortion:
aug = OpticalDistortion(p=1, distort_limit=2, shift_limit=0.5)
augmented = aug(image=image, mask=mask)

image_optical = augmented['image']
mask_optical = augmented['mask']

visualize(image_optical, mask_optical,
          original_image=image, original_mask=mask)
RandomSizedCrop:
RandomCrop 和 RandomScale 组合.
aug = RandomSizedCrop(p=1,
                      min_max_height=(50, 101),
                      height=original_height,
                      width=original_width)
augmented = aug(image=image, mask=mask)

image_scaled = augmented['image']
mask_scaled = augmented['mask']

visualize(image_scaled, mask_scaled,
          original_image=image, original_mask=mask)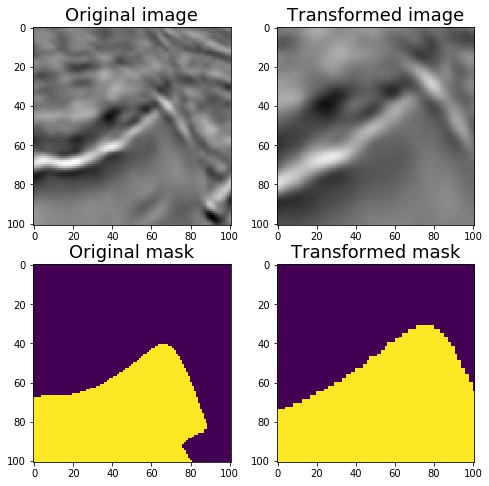
数据增强 - Light,non destructive augmentations:
aug = Compose([VerticalFlip(p=0.5),
              RandomRotate90(p=0.5)])

augmented = aug(image=image, mask=mask)

image_light = augmented['image']
mask_light = augmented['mask']

visualize(image_light, mask_light,
          original_image=image, original_mask=mask)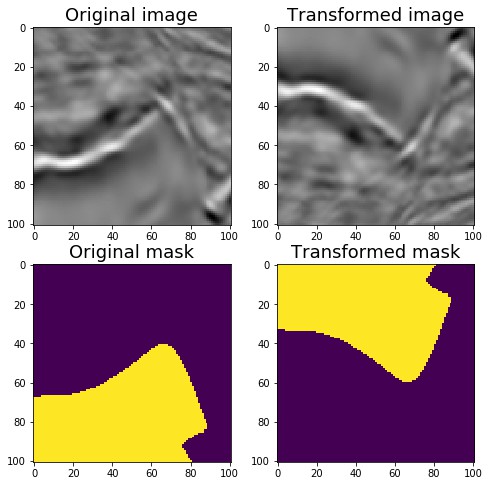
数据增强 - Medium:
aug = Compose([
    OneOf([RandomSizedCrop(min_max_height=(50, 101),
                           height=original_height,
                           width=original_width, p=0.5),
          PadIfNeeded(min_height=original_height,
                      min_width=original_width, p=0.5)], p=1),
    VerticalFlip(p=0.5),
    RandomRotate90(p=0.5),
    OneOf([ElasticTransform(p=0.5,
                            alpha=120,
                            sigma=120 * 0.05,
                            alpha_affine=120 * 0.03),
        GridDistortion(p=0.5),
        OpticalDistortion(p=1,
                          distort_limit=1,
                          shift_limit=0.5)
        ], p=0.8)])

augmented = aug(image=image, mask=mask)

image_medium = augmented['image']
mask_medium = augmented['mask']

visualize(image_medium, mask_medium,
          original_image=image, original_mask=mask)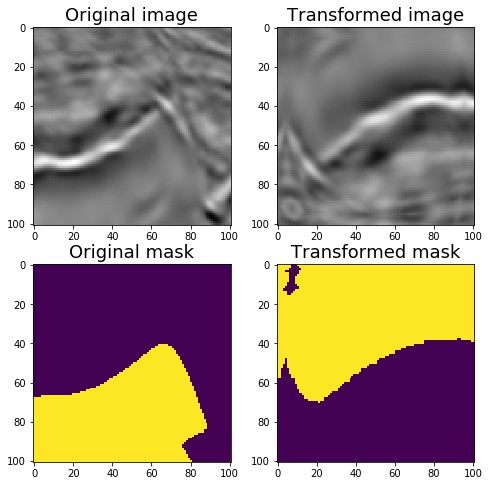
数据增强 - Strong:
添加 CLAHE, RandomBrightness, RandomContrast, RandomGamma 等只对图片进行非空间变换处理,而不对 mask 处理.
aug = Compose([
    OneOf([RandomSizedCrop(min_max_height=(50, 101),
                           height=original_height,
                           width=original_width, p=0.5),
          PadIfNeeded(min_height=original_height,
                      min_width=original_width, p=0.5)], p=1),
    VerticalFlip(p=0.5),
    RandomRotate90(p=0.5),
    OneOf([ElasticTransform(p=0.5,
                            alpha=120,
                            sigma=120 * 0.05,
                            alpha_affine=120 * 0.03),
        GridDistortion(p=0.5),
        OpticalDistortion(p=1, distort_limit=2, shift_limit=0.5)
        ], p=0.8),
    CLAHE(p=0.8),
    RandomContrast(p=0.8),
    RandomBrightness(p=0.8),
    RandomGamma(p=0.8)])

augmented = aug(image=image, mask=mask)

image_heavy = augmented['image']
mask_heavy = augmented['mask']

visualize(image_heavy, mask_heavy, original_image=image, original_mask=mask)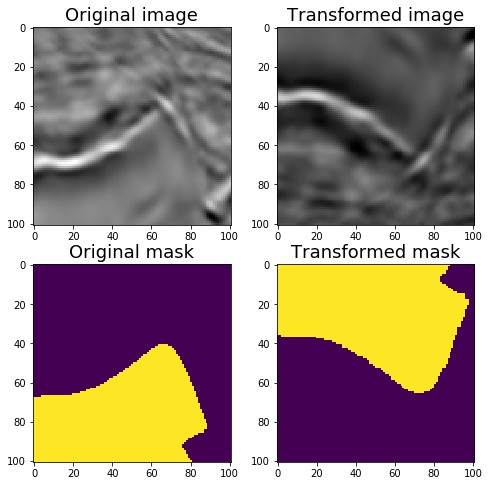
4.4 Non-8-bit images 示例
example_16_bit_tiff.ipynb
from io import BytesIO
from zipfile import ZipFile
from urllib.request import urlopen

import cv2
import numpy as np
from matplotlib import pyplot as plt

from albumentations import (
    Compose, ToFloat, FromFloat, RandomRotate90,
    Flip, OneOf, MotionBlur, MedianBlur, Blur,
    ShiftScaleRotate, OpticalDistortion, GridDistortion,
    RandomContrast, RandomBrightness, HueSaturationValue,
)

# 下载 16-bit TIFF 图片
url = urlopen("http://www.brucelindbloom.com/downloads/DeltaE_16bit_gamma1.0.tif.zip")
zipfile = ZipFile(BytesIO(url.read()))
zip_names = zipfile.namelist()
file_name = zip_names.pop()
extracted_file = zipfile.open(file_name)
data = np.frombuffer(extracted_file.read(), np.uint16)

img = cv2.imdecode(data, cv2.IMREAD_UNCHANGED)
img = cv2.cvtColor(img, cv2.COLOR_BGR2RGB)

# OpenCV may read incorrectly some TIFF files.
# Consider using `tifffile` - https://github.com/blink1073/tifffile

print(img.dtype)
# dtype('uint16')

# Divide all values by 65535 so we can display the image using matplotlib
plt.imshow(img / 65535)
plt.show()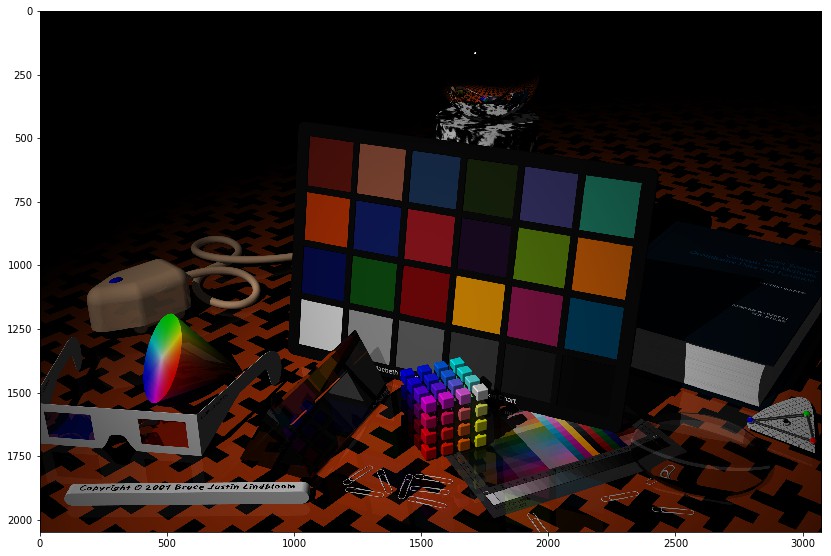
def strong_tiff_aug(p=.5):
    return Compose([
        # albumentations 支持 uint8 和 float32 输入.
        # 对于 float32, 所有的值必须在 [0.0, 1.0] 之间.
        # 在数据增强变换前,首先进行 `ToFloat()` 处理, 将图像转化为 float32 ndarray.
        ToFloat(),

        # 或者指定输入的最大值
        # ToFloat(max_value=65535.0),

        # 然后进行数据增强
        RandomRotate90(),
        Flip(),
        OneOf([
            MotionBlur(p=0.2),
            MedianBlur(blur_limit=3, p=0.1),
            Blur(blur_limit=3, p=0.1),
        ], p=0.2),
        ShiftScaleRotate(shift_limit=0.0625,
                         scale_limit=0.2,
                         rotate_limit=45, p=.2),
        OneOf([
            OpticalDistortion(p=0.3),
            GridDistortion(p=0.1),
        ], p=0.2),
        OneOf([
            RandomContrast(),
            RandomBrightness(),
        ], p=0.3),
        HueSaturationValue(hue_shift_limit=20,
                           sat_shift_limit=0.1,
                           val_shift_limit=0.1, p=0.3),

        # 可以采用 `FromFloat` 将增强后的图像,转换为原始的数据类型.
        # FromFloat(dtype='uint16'),

        # 可以指定`max_value`,则所有的值都会乘以该值.
        # FromFloat(dtype='uint16', max_value=65535.0),
    ], p=p)

augmentation = strong_tiff_aug(p=0.9)
augmented = augmentation(image=img)
plt.figure(figsize=(14, 14))
plt.imshow(augmented['image'])
plt.show()
1 条评论
例子showcase里的函数:def augment_and_show(): 这里image_aug=cv2.cvtColor(augmented['image'], cv2.COLOR_BGR2RGB) 这里为什么又要一次BGR转RGB