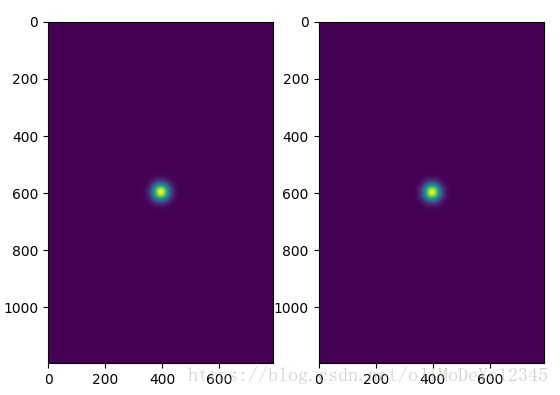
将关键点 (x,y) 坐标转化为 NxN heatmap.
相对于直接回归关键点 groundtruth 为 (x, y) 而言.
groundtruth 由 (x, y) 变为 heatmap 形式,
这里探索了几种不同的生成 heatmap 的方法.
import time
import numpy as np
import cv2
import matplotlib.pyplot as plt


def CenterLabelHeatMap(img_width, img_height, c_x, c_y, sigma):
    X1 = np.linspace(1, img_width, img_width)
    Y1 = np.linspace(1, img_height, img_height)
    [X, Y] = np.meshgrid(X1, Y1)
    X = X - c_x
    Y = Y - c_y
    D2 = X * X + Y * Y
    E2 = 2.0 * sigma * sigma
    Exponent = D2 / E2
    heatmap = np.exp(-Exponent)
    return heatmap


# Compute gaussian kernel
def CenterGaussianHeatMap(img_height, img_width, c_x, c_y, variance):
    gaussian_map = np.zeros((img_height, img_width))
    for x_p in range(img_width):
        for y_p in range(img_height):
            dist_sq = (x_p - c_x) * (x_p - c_x) + \
                      (y_p - c_y) * (y_p - c_y)
            exponent = dist_sq / 2.0 / variance / variance
            gaussian_map[y_p, x_p] = np.exp(-exponent)
    return gaussian_map


image_file = 'test.jpg'
img = cv2.imread(image_file)
img = img[:,:,::-1]

height, width,_ = np.shape(img)
cy, cx = height/2.0, width/2.0

start = time.time()
heatmap1 = CenterLabelHeatMap(width, height, cx, cy, 21)
t1 = time.time() - start

start = time.time()
heatmap2 = CenterGaussianHeatMap(height, width, cx, cy, 21)
t2 = time.time() - start

print(t1, t2)

plt.subplot(1,2,1)
plt.imshow(heatmap1)
plt.subplot(1,2,2)
plt.imshow(heatmap2)
plt.show()

print('End.')
(t1, t2): (0.020607948303222656, 0.6914258003234863)

CPM 给出的 C++ 实现:
template<typename Dtype>
void DataTransformer<Dtype>::putGaussianMaps(Dtype* entry, Point2f center, int stride, int grid_x, int grid_y, float sigma){
  //LOG(INFO) << "putGaussianMaps here we start for " << center.x << " " << center.y;
  float start = stride/2.0 - 0.5; //0 if stride = 1, 0.5 if stride = 2, 1.5 if stride = 4, ...
  for (int g_y = 0; g_y < grid_y; g_y++){
    for (int g_x = 0; g_x < grid_x; g_x++){
      float x = start + g_x * stride;
      float y = start + g_y * stride;
      float d2 = (x-center.x)*(x-center.x) + (y-center.y)*(y-center.y);
      float exponent = d2 / 2.0 / sigma / sigma;
      if(exponent > 4.6052){ //ln(100) = -ln(1%)
        continue;
      }
      entry[g_y*grid_x + g_x] += exp(-exponent);
      if(entry[g_y*grid_x + g_x] > 1)
        entry[g_y*grid_x + g_x] = 1;
    }
  }
}
4 comments
博主,您好!
1、很想知道这里面 CenterLabelHeatMap和用高斯核有什么区别?
2、这里面有个传递的参数21不清楚是干嘛的?
3、因为想自己理解一下生成热点图的一个理论理解,有什么好的建议?
谢谢你
1.只是方式的不同,原理一致.
2.21 是高斯核的大小.
3.pose estimation 中最早出现 heatmap 应该是论文:Flowing ConvNets for Human Pose Estimation in Videos-ICCV2015
谢谢博主的回复。科研路上有你们这些小伙伴真好。真心谢谢你的耐心回复
加油!